InterpolateDetectorMetricPlot
- class lsst.analysis.tools.actions.plot.InterpolateDetectorMetricPlot(*args, **kw)
Bases:
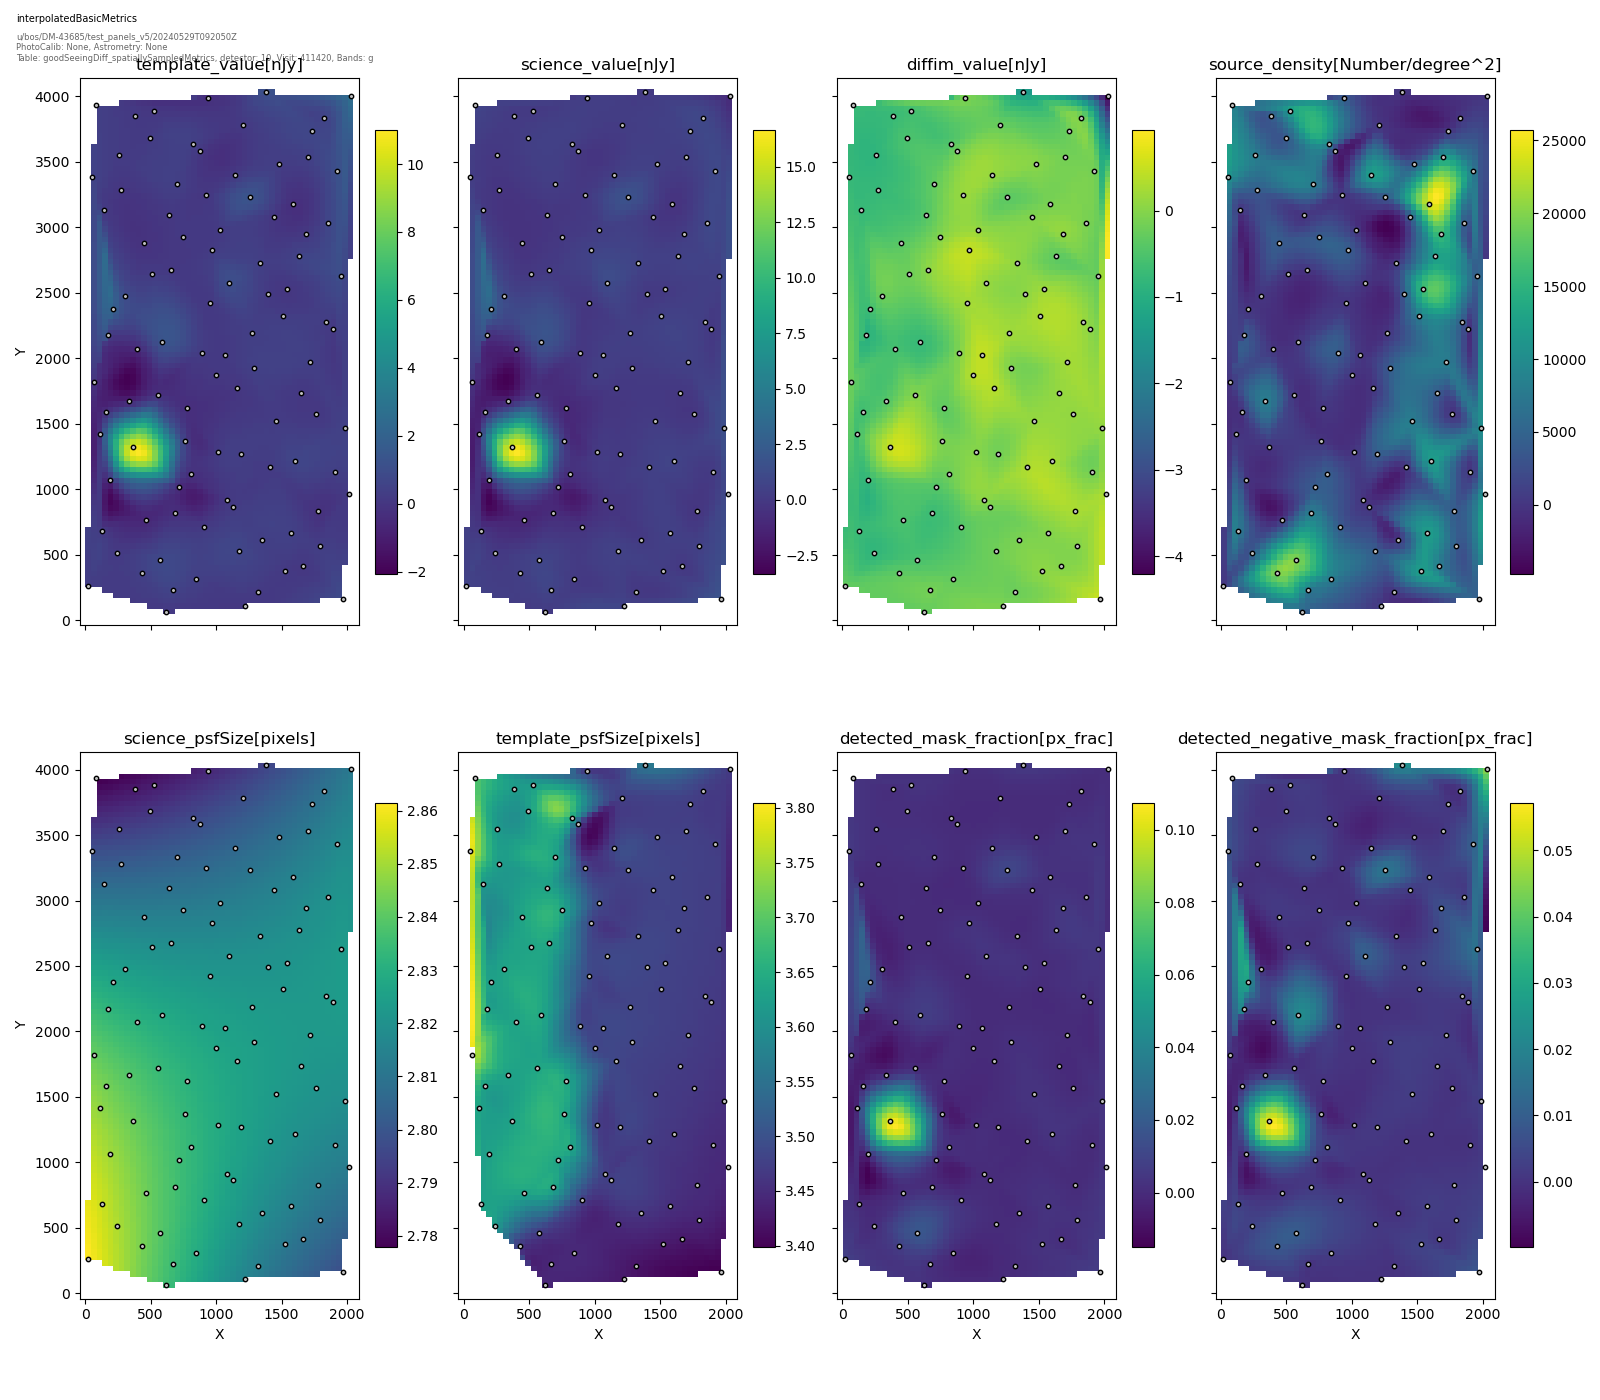
PlotActionInterpolate metrics evaluated at locations across a detector.
The provided list of metric names and labels enables the creation of a multi-panel plot, with the 2D interpolation of the input metric values sampled on the given detector x and y coordinates. The interpolation evaluation grid can be controlled with the margin and number of grid points.
Attributes Summary
Grid margins for the field to interpolate (
int, default20)Metrics to pull data from for interpolation (
List)N points in the grid for the field to interpolate (
int, default50)Label to use for the x axis.
Dimensions for X direction field to interpolate (
int, default4096)Label to use for the y axis.
Dimensions for Y direction field to interpolate (
int, default4096)Labels to use for the z axis.
Methods Summary
__call__(data, **kwargs)Call self as a function.
Return the schema an
AnalysisActionexpects to be present in the arguments supplied to the __call__ method.makePlot(data[, plotInfo])Makes a plot of a smooth interpolation of randomly sampled metrics in the image domain.
Attributes Documentation
- metricNames
Metrics to pull data from for interpolation (
List)
- zAxisLabels
Labels to use for the z axis. (
List, defaultNone)
Methods Documentation
- __call__(data: MutableMapping[str, ndarray[Any, dtype[_ScalarType_co]] | Scalar | HealSparseMap | Tensor | Mapping], **kwargs) Mapping[str, Figure] | Figure
Call self as a function.
- getInputSchema() Mapping]]]
Return the schema an
AnalysisActionexpects to be present in the arguments supplied to the __call__ method.- Returns:
- result
KeyedDataSchema The schema this action requires to be present when calling this action, keys are unformatted.
- result
- makePlot(data: MutableMapping[str, ndarray[Any, dtype[_ScalarType_co]] | Scalar | HealSparseMap | Tensor | Mapping], plotInfo: Mapping[str, str] | None = None, **kwargs) Figure
Makes a plot of a smooth interpolation of randomly sampled metrics in the image domain.
- Parameters:
- data
KeyedData The catalog to plot the points from, the catalog needs to have columns:
"x"The x image coordinate of the input metric values
"y"The y image coordinate of the input metric values
- metricNames
The column names of each image metric that needs to be interpolated.
- plotInfo
dict Optional. A dictionary of information about the data being plotted
- data
- Returns:
- fig
matplotlib.figure.Figure The resulting figure.
- fig
Notes
Uses the zAxisLabels config option to write the metric units and title for each of the used panels. The number of plots is determined from the number of
metricNamesin the config options. The colorbar of the interpolation is included for each panel, as well as a scatter plot showing the locations of the metric sampling locations.Examples
An example of the plot produced from this code is here:
For a detailed example of how to make a plot from the command line please see the getting started guide.