WholeSkyPlot
- class lsst.analysis.tools.actions.plot.WholeSkyPlot(*args, **kw)
Bases:
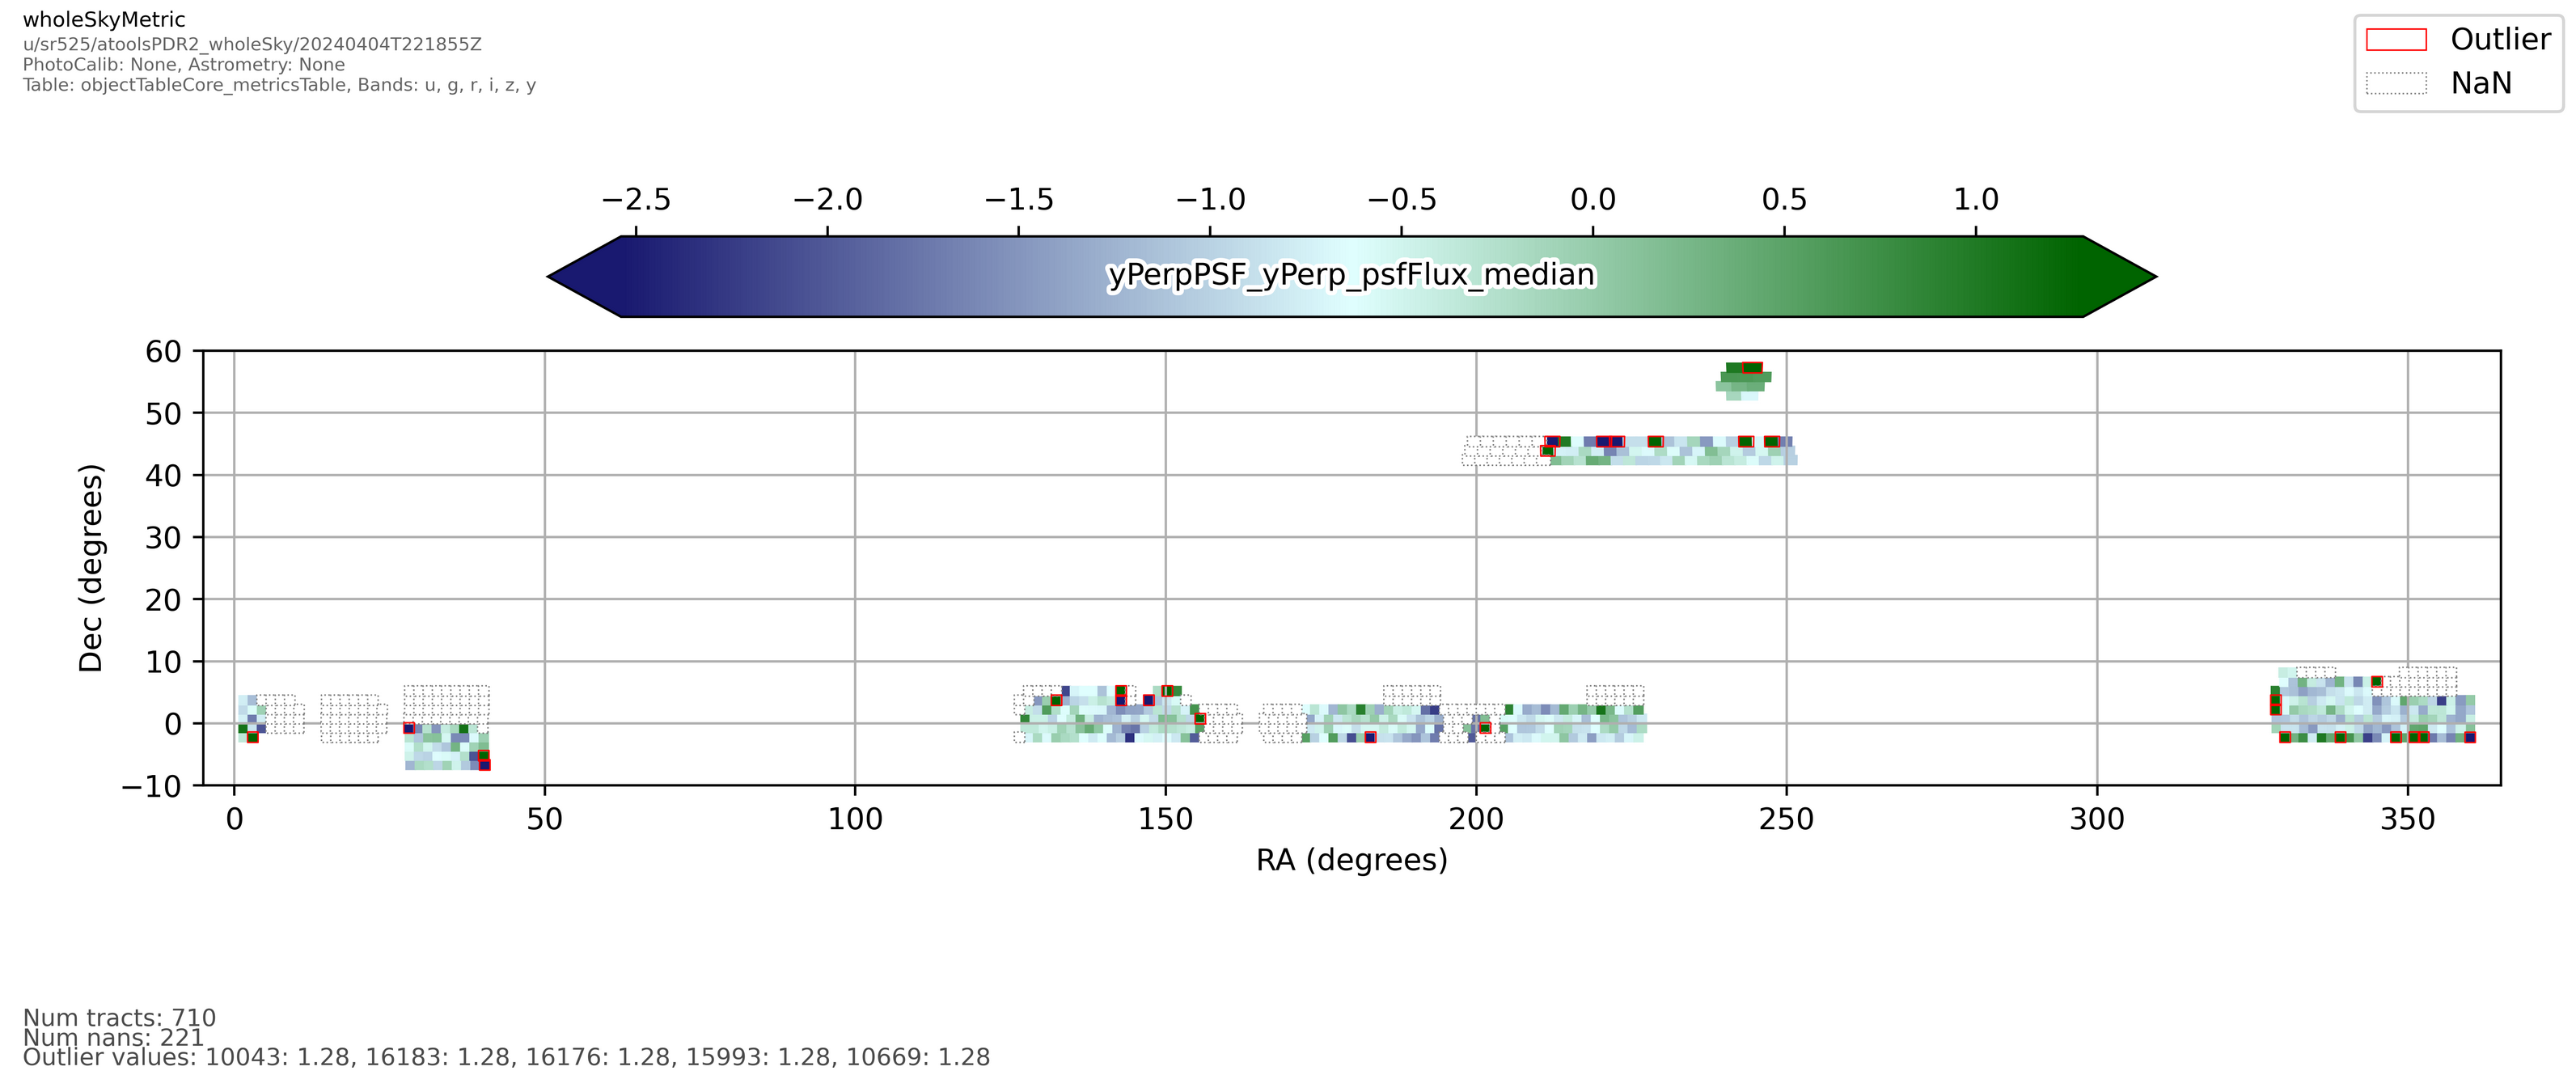
PlotActionPlots the on sky distribution of a parameter.
Plots the values of the parameter given for the z axis according to the positions given for x and y. Optimised for use with RA and Dec. Also calculates some basic statistics and includes those on the plot.
The default axes limits and figure size were chosen to plot HSC PDR2.
Attributes Summary
Find axes limits automatically.
The multiplier for the color bar range.
List of hexidecimal colors for a user-defined color map.
Type of color map to use for the color bar.
Size of the figure.
Label to use for the x axis.
Plotting limits for the x axis.
Label to use for the y axis.
Plotting limits for the y axis.
Label to use for the z axis.
Methods Summary
__call__(data, **kwargs)Call self as a function.
getInputSchema(**kwargs)Return the schema an
AnalysisActionexpects to be present in the arguments supplied to the __call__ method.makePlot(data[, plotInfo])Make a WholeSkyPlot of the given data.
Attributes Documentation
- colorBarRange
The multiplier for the color bar range. The max/min range values are: median +/- N * sigmaMad, where N is this config value. (
float, default3.0)
- colorMap
List of hexidecimal colors for a user-defined color map. (
List, defaultNone)
- colorMapType
Type of color map to use for the color bar. Options: sequential, divergent, userDefined. (
str, default'divergent')Allowed values:
'sequential'sequential
'divergent'divergent
'None'Field is optional
- figureSize
Size of the figure. (
List, default[9.0, 3.5])
- xLimits
Plotting limits for the x axis. (
List, default[-5.0, 365.0])
- yLimits
Plotting limits for the y axis. (
List, default[-10.0, 60.0])
Methods Documentation
- __call__(data: MutableMapping[str, ndarray[tuple[int, ...], dtype[_ScalarType_co]] | Scalar | HealSparseMap | Tensor | Mapping], **kwargs) Mapping[str, Figure] | Figure
Call self as a function.
- getInputSchema(**kwargs) Mapping]]]
Return the schema an
AnalysisActionexpects to be present in the arguments supplied to the __call__ method.- Returns:
- result
KeyedDataSchema The schema this action requires to be present when calling this action, keys are unformatted.
- result
- makePlot(data: MutableMapping[str, ndarray[tuple[int, ...], dtype[_ScalarType_co]] | Scalar | HealSparseMap | Tensor | Mapping], plotInfo: Mapping[str, str] | None = None, **kwargs) Figure
Make a WholeSkyPlot of the given data.
- Parameters:
- data
KeyedData The catalog to plot the points from.
- plotInfo
dict A dictionary of information about the data being plotted with keys:
- data
- Returns:
pipeBase.Structcontaining:- skyPlot
matplotlib.figure.Figure The resulting figure.
- skyPlot
Examples
An example of the plot produced from this code is here:
For a detailed example of how to make a plot from the command line please see the getting started guide.