WholeTractImage
- class lsst.analysis.tools.actions.plot.WholeTractImage(*args, **kw)
Bases:
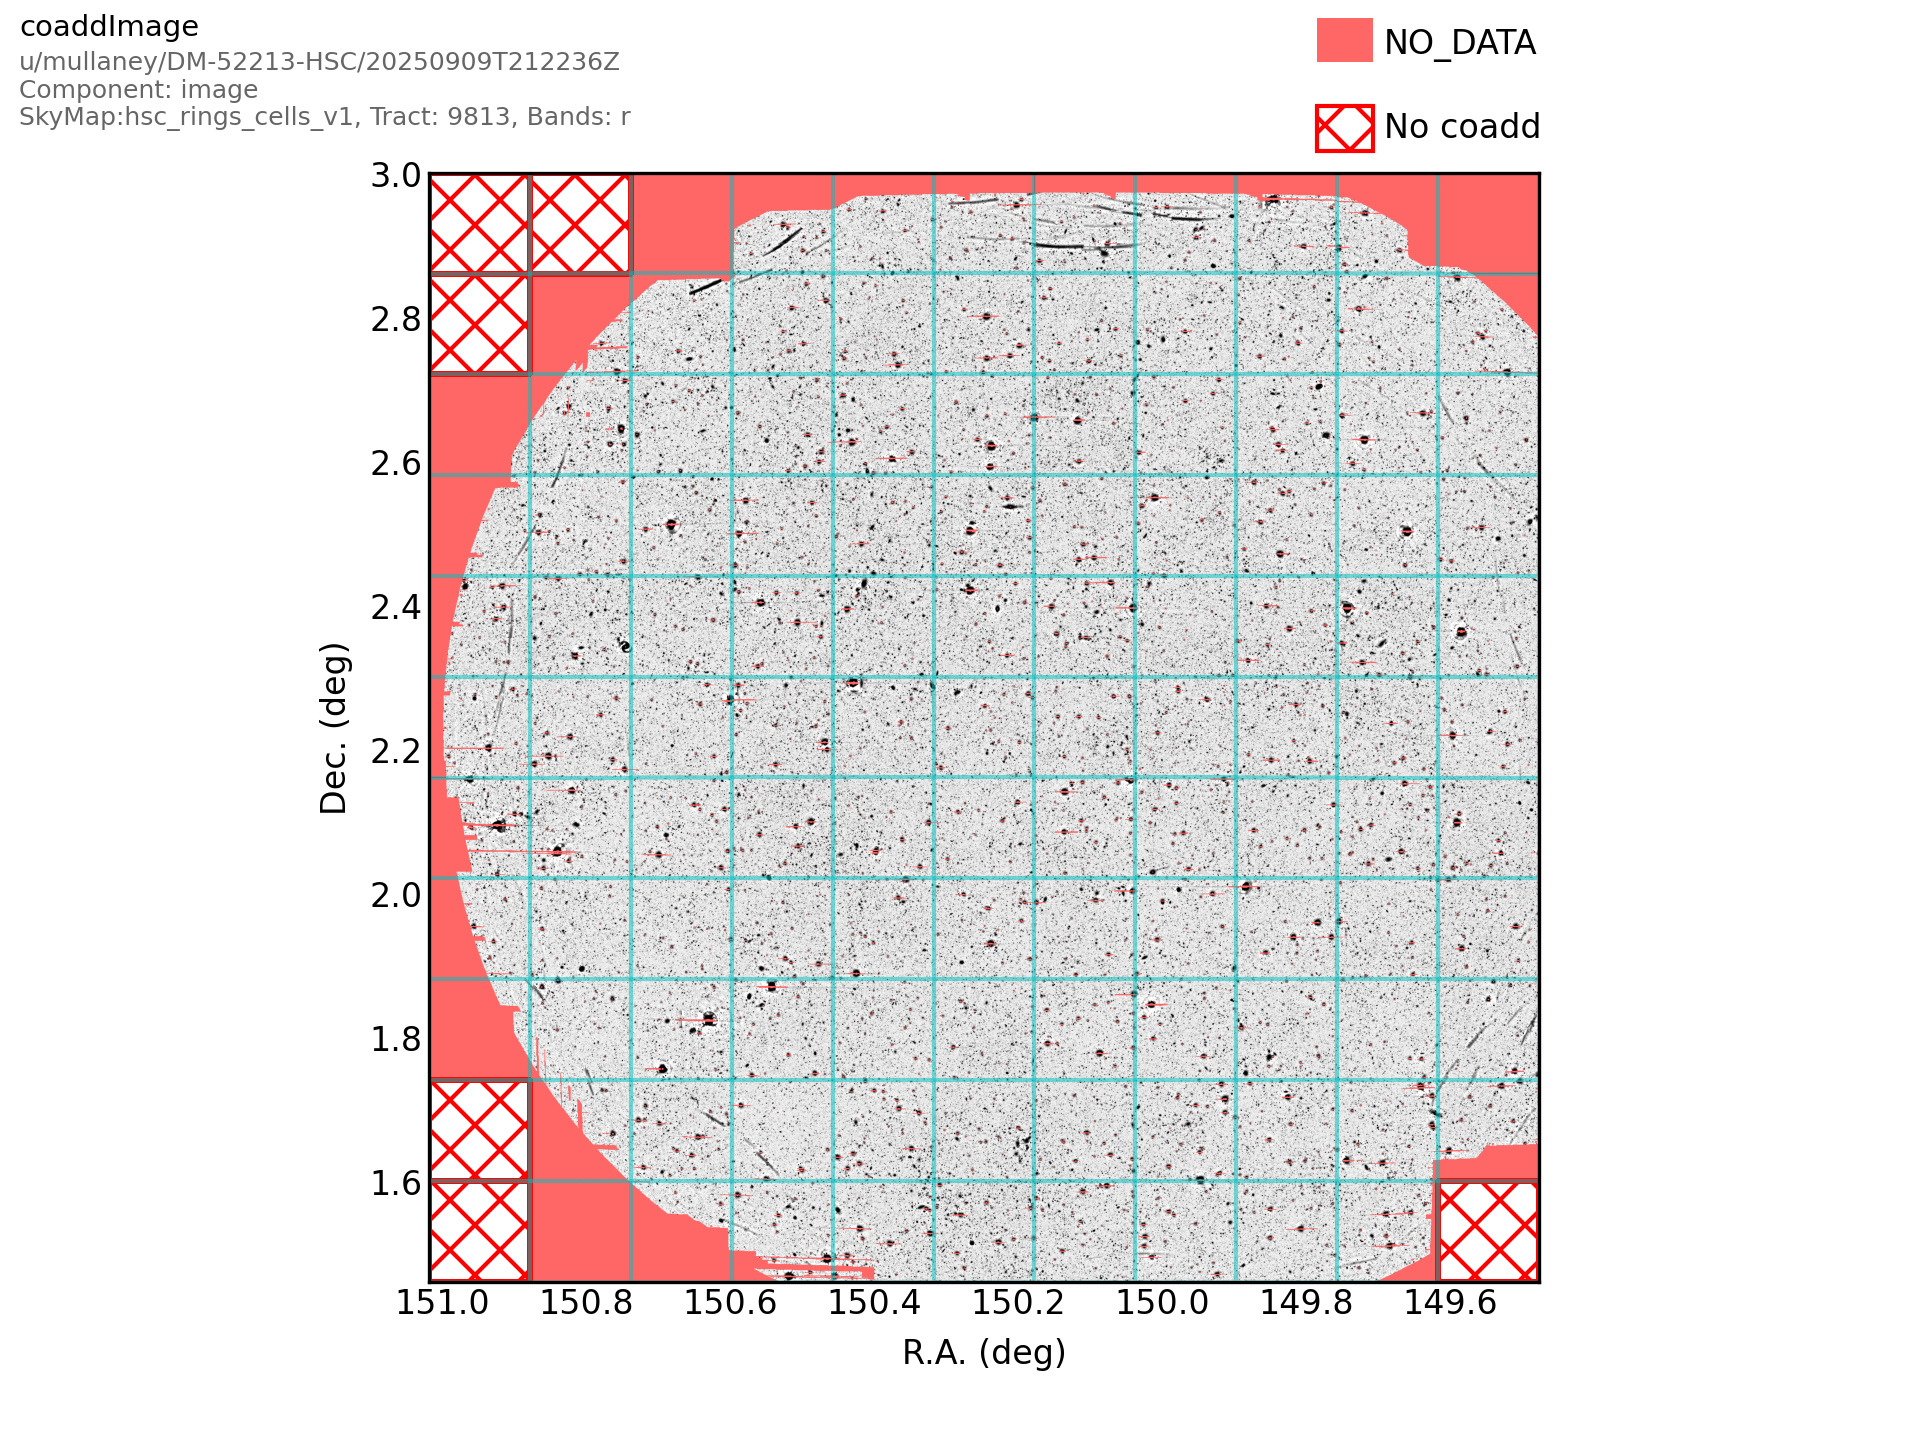
PlotActionProduces a figure displaying whole-tract coadd pixel data as a 2D image.
The figure is constructed from all patches covering the tract. Regions of NO_DATA or where no coadd exists are shown as red shading or red hatches, respectively.
Either the image, pixel mask, or variance components of the coadd can be displayed. In the case of the pixel mask, one or more bitmaskPlanes must be specified; the specified bitmaskPlanes are OR-combined, with flagged pixels given a value of 1, and unflagged pixels given a value of 1.
Attributes Summary
List of names of bitmask plane(s) to display when displaying the mask plane.
Matplotlib colormap to use for the displayed image.
Coadd component to display.
Display as a figure to be used as postage stamp.
Action to calculate the min and max values of the image scale.
Matplotlib color to use to indicate regions of no data.
If data doesn't contain a mask plane, the value in the image plane to assign the noDataColor to.
Show a colorbar alongside the main plot.
Show the patch IDs in the centre of each patch.
Action to calculate the stretch of the image scale.
The floor of the vmax value of the colorbar (
float, defaultNone)Label to display on the colorbar.
Methods Summary
__call__(data, **kwargs)Call self as a function.
Return the schema an
AnalysisActionexpects to be present in the arguments supplied to the __call__ method.makeFigure(data, tractId, skymap[, plotInfo])Make a figure displaying the input pixel data.
validate()Validate the Config, raising an exception if invalid.
Attributes Documentation
- bitmaskPlanes
List of names of bitmask plane(s) to display when displaying the mask plane. Bitmask planes are OR-combined. Flagged pixels are given a value of 1; unflagged pixels are given a value of 0. Optional when displaying either the image or variance planes. Required when displaying the mask plane. (
List, defaultNone)
- colorbarCmap
Matplotlib colormap to use for the displayed image. Default: gray (
str, default'gray')Allowed values:
'magma'magma
'inferno'inferno
'plasma'plasma
'viridis'viridis
'cividis'cividis
'twilight'twilight
'twilight_shifted'twilight_shifted
'turbo'turbo
'berlin'berlin
'managua'managua
'vanimo'vanimo
'Blues'Blues
'BrBG'BrBG
'BuGn'BuGn
'BuPu'BuPu
'CMRmap'CMRmap
'GnBu'GnBu
'Greens'Greens
'Greys'Greys
'OrRd'OrRd
'Oranges'Oranges
'PRGn'PRGn
'PiYG'PiYG
'PuBu'PuBu
'PuBuGn'PuBuGn
'PuOr'PuOr
'PuRd'PuRd
'Purples'Purples
'RdBu'RdBu
'RdGy'RdGy
'RdPu'RdPu
'RdYlBu'RdYlBu
'RdYlGn'RdYlGn
'Reds'Reds
'Spectral'Spectral
'Wistia'Wistia
'YlGn'YlGn
'YlGnBu'YlGnBu
'YlOrBr'YlOrBr
'YlOrRd'YlOrRd
'afmhot'afmhot
'autumn'autumn
'binary'binary
'bone'bone
'brg'brg
'bwr'bwr
'cool'cool
'coolwarm'coolwarm
'copper'copper
'cubehelix'cubehelix
'flag'flag
'gist_earth'gist_earth
'gist_gray'gist_gray
'gist_heat'gist_heat
'gist_ncar'gist_ncar
'gist_rainbow'gist_rainbow
'gist_stern'gist_stern
'gist_yarg'gist_yarg
'gnuplot'gnuplot
'gnuplot2'gnuplot2
'gray'gray
'hot'hot
'hsv'hsv
'jet'jet
'nipy_spectral'nipy_spectral
'ocean'ocean
'pink'pink
'prism'prism
'rainbow'rainbow
'seismic'seismic
'spring'spring
'summer'summer
'terrain'terrain
'winter'winter
'Accent'Accent
'Dark2'Dark2
'Paired'Paired
'Pastel1'Pastel1
'Pastel2'Pastel2
'Set1'Set1
'Set2'Set2
'Set3'Set3
'tab10'tab10
'tab20'tab20
'tab20b'tab20b
'tab20c'tab20c
'grey'grey
'gist_grey'gist_grey
'gist_yerg'gist_yerg
'Grays'Grays
'magma_r'magma_r
'inferno_r'inferno_r
'plasma_r'plasma_r
'viridis_r'viridis_r
'cividis_r'cividis_r
'twilight_r'twilight_r
'twilight_shifted_r'twilight_shifted_r
'turbo_r'turbo_r
'berlin_r'berlin_r
'managua_r'managua_r
'vanimo_r'vanimo_r
'Blues_r'Blues_r
'BrBG_r'BrBG_r
'BuGn_r'BuGn_r
'BuPu_r'BuPu_r
'CMRmap_r'CMRmap_r
'GnBu_r'GnBu_r
'Greens_r'Greens_r
'Greys_r'Greys_r
'OrRd_r'OrRd_r
'Oranges_r'Oranges_r
'PRGn_r'PRGn_r
'PiYG_r'PiYG_r
'PuBu_r'PuBu_r
'PuBuGn_r'PuBuGn_r
'PuOr_r'PuOr_r
'PuRd_r'PuRd_r
'Purples_r'Purples_r
'RdBu_r'RdBu_r
'RdGy_r'RdGy_r
'RdPu_r'RdPu_r
'RdYlBu_r'RdYlBu_r
'RdYlGn_r'RdYlGn_r
'Reds_r'Reds_r
'Spectral_r'Spectral_r
'Wistia_r'Wistia_r
'YlGn_r'YlGn_r
'YlGnBu_r'YlGnBu_r
'YlOrBr_r'YlOrBr_r
'YlOrRd_r'YlOrRd_r
'afmhot_r'afmhot_r
'autumn_r'autumn_r
'binary_r'binary_r
'bone_r'bone_r
'brg_r'brg_r
'bwr_r'bwr_r
'cool_r'cool_r
'coolwarm_r'coolwarm_r
'copper_r'copper_r
'cubehelix_r'cubehelix_r
'flag_r'flag_r
'gist_earth_r'gist_earth_r
'gist_gray_r'gist_gray_r
'gist_heat_r'gist_heat_r
'gist_ncar_r'gist_ncar_r
'gist_rainbow_r'gist_rainbow_r
'gist_stern_r'gist_stern_r
'gist_yarg_r'gist_yarg_r
'gnuplot_r'gnuplot_r
'gnuplot2_r'gnuplot2_r
'gray_r'gray_r
'hot_r'hot_r
'hsv_r'hsv_r
'jet_r'jet_r
'nipy_spectral_r'nipy_spectral_r
'ocean_r'ocean_r
'pink_r'pink_r
'prism_r'prism_r
'rainbow_r'rainbow_r
'seismic_r'seismic_r
'spring_r'spring_r
'summer_r'summer_r
'terrain_r'terrain_r
'winter_r'winter_r
'Accent_r'Accent_r
'Dark2_r'Dark2_r
'Paired_r'Paired_r
'Pastel1_r'Pastel1_r
'Pastel2_r'Pastel2_r
'Set1_r'Set1_r
'Set2_r'Set2_r
'Set3_r'Set3_r
'tab10_r'tab10_r
'tab20_r'tab20_r
'tab20b_r'tab20b_r
'tab20c_r'tab20c_r
'grey_r'grey_r
'gist_grey_r'gist_grey_r
'gist_yerg_r'gist_yerg_r
'Grays_r'Grays_r
'rocket'rocket
'rocket_r'rocket_r
'mako'mako
'mako_r'mako_r
'icefire'icefire
'icefire_r'icefire_r
'vlag'vlag
'vlag_r'vlag_r
'flare'flare
'flare_r'flare_r
'crest'crest
'crest_r'crest_r
'None'Field is optional
- component
Coadd component to display. Can take one of image, mask, variance. Default: image. (
str, default'image')Allowed values:
'image'image
'mask'mask
'variance'variance
'None'Field is optional
- displayAsPostageStamp
Display as a figure to be used as postage stamp. No plotInfo or legend is shown, and large fonts are used for axis labels. (
bool, defaultFalse)
- interval
Action to calculate the min and max values of the image scale. Default: Perc. (
VectorAction, default<class 'lsst.analysis.tools.actions.plot.calculateRange.Perc'>)
- noDataColor
Matplotlib color to use to indicate regions of no data. Default: red (
str, default'red')
- noDataValue
If data doesn’t contain a mask plane, the value in the image plane to assign the noDataColor to. Optional. (
int, defaultNone)
- stretch
Action to calculate the stretch of the image scale. Default: Asinh (
TensorAction, default<class 'lsst.analysis.tools.actions.plot.calculateRange.Asinh'>)
Methods Documentation
- __call__(data: MutableMapping[str, ndarray[tuple[int, ...], dtype[_ScalarType_co]] | Scalar | HealSparseMap | Tensor | Mapping], **kwargs) Mapping[str, Figure] | Figure
Call self as a function.
- getInputSchema() Mapping]]]
Return the schema an
AnalysisActionexpects to be present in the arguments supplied to the __call__ method.- Returns:
- result
KeyedDataSchema The schema this action requires to be present when calling this action, keys are unformatted.
- result
- makeFigure(data: MutableMapping[str, ndarray[tuple[int, ...], dtype[_ScalarType_co]] | Scalar | HealSparseMap | Tensor | Mapping], tractId: int, skymap: BaseSkyMap, plotInfo: Mapping[str, str] | None = None, **kwargs) Figure
Make a figure displaying the input pixel data.
- Parameters:
- data
lsst.analysis.tools.interfaces.KeyedData A python dict-of-dicts containing the pixel data to display in the figure. The top level keys are named after the coadd component(s), and must contain at least ‘mask’. The next level keys are named after the patch ID of the coadd component contained as their corresponding value.
- tractId
int Identification number of the tract to be displayed.
- skymap
lsst.skymap.BaseSkyMap The sky map used for this dataset. This is referred-to to determine the location of the tract on-sky (for RA and Dec axis ranges) and the location of the patches within the tract.
- plotInfo
dict, optional A dictionary of information about the data being plotted with keys:
- data
- Returns:
- fig
matplotlib.figure.Figure The resulting figure.
- fig
Examples
An example wholeTractImage plot may be seen below:
For further details on how to generate a plot, please refer to the getting started guide.
- validate()
Validate the Config, raising an exception if invalid.
- Raises:
- lsst.pex.config.FieldValidationError
Raised if verification fails.
Notes
The base class implementation performs type checks on all fields by calling their
validatemethods.Complex single-field validation can be defined by deriving new Field types. For convenience, some derived
lsst.pex.config.Field-types (ConfigFieldandConfigChoiceField) are defined inlsst.pex.configthat handle recursing into subconfigs.Inter-field relationships should only be checked in derived
Configclasses after calling this method, and base validation is complete.