ColorColorFitPlot
- class lsst.analysis.tools.actions.plot.ColorColorFitPlot(*args, **kw)
Bases:
PlotActionMake a color-color plot and overplot a prefited line to the fit region.
This is mostly used for the stellar locus plots and also includes panels that illustrate the goodness of the given fit.
Attributes Summary
Apply a
Contextto anAnalysisActionrecursively.Plot distance from fit as a function of color in lower right panel? (
bool, defaultTrue)Plot distance from fit histograms separated into blue and red star subsamples? (
bool, defaultFalse)If a configurable action is assigned to a
ConfigurableActionField, or aConfigurableActionStructFieldthe name of the field will be bound to this variable when it is retrieved.Label to use for the magnitudes used to color code by (
str)Minimum number of valid objects to bother attempting a fit.
The name for the plot.
Selection of types of objects to plot.
Use a publication-quality plot style.
Label to use for the x axis (
str)Minimum and maximum x-axis limit to force (provided as a list of [xMin, xMax]).
Label to use for the y axis (
str)Minimum and maximum y-axis limit to force (provided as a list of [yMin, yMax]).
Methods Summary
__call__(data, **kwargs)Call self as a function.
addInputSchema(inputSchema)Add the supplied inputSchema argument to the class such that it will be returned along side any other arguments in a call to
getInputSchema.compare(other[, shortcut, rtol, atol, output])Compare this configuration to another
Configfor equality.copy()Return a deep copy of this config.
formatHistory(name, **kwargs)Format a configuration field's history to a human-readable format.
freeze()Make this config, and all subconfigs, read-only.
getFormattedInputSchema(**kwargs)Return input schema, with keys formatted with any arguments supplied by kwargs passed to this method.
getInputSchema(**kwargs)Return the schema an
AnalysisActionexpects to be present in the arguments supplied to the __call__ method.getOutputNames([config])Returns a list of names that will be used as keys if this action's call method returns a mapping.
Return the schema an
AnalysisActionwill produce, if the__call__method returnsKeyedData, otherwise this may return None.items()Get configurations as
(field name, field value)pairs.keys()Get field names.
load(filename[, root])Modify this config in place by executing the Python code in a configuration file.
loadFromStream(stream[, root, filename, ...])Modify this Config in place by executing the Python code in the provided stream.
loadFromString(code[, root, filename, ...])Modify this Config in place by executing the Python code in the provided string.
makePlot(data, plotInfo, **kwargs)Make stellar locus plots using pre fitted values.
names()Get all the field names in the config, recursively.
save(filename[, root])Save a Python script to the named file, which, when loaded, reproduces this config.
saveToStream(outfile[, root, skipImports])Save a configuration file to a stream, which, when loaded, reproduces this config.
saveToString([skipImports])Return the Python script form of this configuration as an executable string.
Subclass hook for computing defaults.
toDict()Make a dictionary of field names and their values.
update(**kw)Update values of fields specified by the keyword arguments.
validate()Validate the Config, raising an exception if invalid.
values()Get field values.
Attributes Documentation
- applyContext
Apply a
Contextto anAnalysisActionrecursively.Generally this method is called from within an
AnalysisToolto configure allAnalysisActions at one time to make sure that they all are consistently configured. However, it is permitted to call this method if you are aware of the effects, or from within a specific execution environment like a python shell or notebook.- Parameters:
- context
Context The specific execution context, this may be a single context or a joint context, see
Contextfor more info.
- context
- doPlotDistVsColor
Plot distance from fit as a function of color in lower right panel? (
bool, defaultTrue)
- doPlotRedBlueHists
Plot distance from fit histograms separated into blue and red star subsamples? (
bool, defaultFalse)
- history
Read-only history.
- identity: str | None = None
If a configurable action is assigned to a
ConfigurableActionField, or aConfigurableActionStructFieldthe name of the field will be bound to this variable when it is retrieved.
- minPointsForFit
Minimum number of valid objects to bother attempting a fit. Deprecated: This field is no longer used. The value should go as an entry to the paramsDict keyed as minObjectForFit. Will be removed after v27. (
int, default5)Valid Range = [1,inf)
- plotTypes
Selection of types of objects to plot. Can take any combination of stars, galaxies, unknown, mag, any. (
List, default['stars'])
- xLims
Minimum and maximum x-axis limit to force (provided as a list of [xMin, xMax]). If
None, limits will be computed and set based on the data. (List, defaultNone)
- yLims
Minimum and maximum y-axis limit to force (provided as a list of [yMin, yMax]). If
None, limits will be computed and set based on the data. (List, defaultNone)
Methods Documentation
- __call__(data: MutableMapping[str, ndarray[tuple[Any, ...], dtype[_ScalarT]] | Scalar | HealSparseMap | Tensor | Mapping], **kwargs) Mapping[str, Figure] | Figure
Call self as a function.
- addInputSchema(inputSchema: Iterable[tuple[str, type[numpy.ndarray[tuple[Any, ...], numpy.dtype[_ScalarT]]] | type[lsst.analysis.tools.interfaces._interfaces.Scalar] | type[healsparse.healSparseMap.HealSparseMap] | type[lsst.analysis.tools.interfaces._interfaces.Tensor] | type[collections.abc.Mapping]]]) None
Add the supplied inputSchema argument to the class such that it will be returned along side any other arguments in a call to
getInputSchema.- Parameters:
- inputSchema
KeyedDataSchema A schema that is to be merged in with any existing schema when a call to
getInputSchemais made.
- inputSchema
- compare(other, shortcut=True, rtol=1e-08, atol=1e-08, output=None)
Compare this configuration to another
Configfor equality.- Parameters:
- other
lsst.pex.config.Config Other
Configobject to compare against this config.- shortcut
bool, optional If
True, return as soon as an inequality is found. Default isTrue.- rtol
float, optional Relative tolerance for floating point comparisons.
- atol
float, optional Absolute tolerance for floating point comparisons.
- output
collections.abc.Callable, optional A callable that takes a string, used (possibly repeatedly) to report inequalities.
- other
- Returns:
- isEqual
bool Truewhen the twolsst.pex.config.Configinstances are equal.Falseif there is an inequality.
- isEqual
See also
Notes
Unselected targets of
RegistryFieldfields and unselected choices ofConfigChoiceFieldfields are not considered by this method.Floating point comparisons are performed by
numpy.allclose.
- copy() ConfigurableAction
Return a deep copy of this config.
Notes
The returned config object is not frozen, even if the original was. If a nested config object is copied, it retains the name from its original hierarchy.
Nested objects are only shared between the new and old configs if they are not possible to modify via the config’s interfaces (e.g. entries in the the history list are not copied, but the lists themselves are, so modifications to one copy do not modify the other).
- formatHistory(name, **kwargs)
Format a configuration field’s history to a human-readable format.
- Parameters:
- name
str Name of a
Fieldin this config.- **kwargs
Keyword arguments passed to
lsst.pex.config.history.format.
- name
- Returns:
- history
str A string containing the formatted history.
- history
See also
- freeze()
Make this config, and all subconfigs, read-only.
- getFormattedInputSchema(**kwargs) Iterable[tuple[str, type[numpy.ndarray[tuple[Any, ...], numpy.dtype[_ScalarT]]] | type[lsst.analysis.tools.interfaces._interfaces.Scalar] | type[healsparse.healSparseMap.HealSparseMap] | type[lsst.analysis.tools.interfaces._interfaces.Tensor] | type[collections.abc.Mapping]]]
Return input schema, with keys formatted with any arguments supplied by kwargs passed to this method.
- Returns:
- result
KeyedDataSchema The schema this action requires to be present when calling this action, formatted with any input arguments (e.g. band=’i’)
- result
- getInputSchema(**kwargs) Iterable[tuple[str, type[numpy.ndarray[tuple[Any, ...], numpy.dtype[_ScalarT]]] | type[lsst.analysis.tools.interfaces._interfaces.Scalar] | type[healsparse.healSparseMap.HealSparseMap] | type[lsst.analysis.tools.interfaces._interfaces.Tensor] | type[collections.abc.Mapping]]]
Return the schema an
AnalysisActionexpects to be present in the arguments supplied to the __call__ method.- Returns:
- result
KeyedDataSchema The schema this action requires to be present when calling this action, keys are unformatted.
- result
- getOutputNames(config: Config | None = None) Iterable[str]
Returns a list of names that will be used as keys if this action’s call method returns a mapping. Otherwise return an empty Iterable.
- Parameters:
- config
lsst.pex.config.Config, optional Configuration of the task. This is only used if the output naming needs to be config-aware.
- config
- Returns:
- result
Iterableofstr If a
PlotActionproduces more than one plot, this should be the keys the action will use in the returnedMapping.
- result
- getOutputSchema() Iterable[tuple[str, type[numpy.ndarray[tuple[Any, ...], numpy.dtype[_ScalarT]]] | type[lsst.analysis.tools.interfaces._interfaces.Scalar] | type[healsparse.healSparseMap.HealSparseMap] | type[lsst.analysis.tools.interfaces._interfaces.Tensor] | type[collections.abc.Mapping]]] | None
Return the schema an
AnalysisActionwill produce, if the__call__method returnsKeyedData, otherwise this may return None.- Returns:
- result
KeyedDataSchemaor None The schema this action will produce when returning from call. This will be unformatted if any templates are present. Should return None if action does not return
KeyedData.
- result
- items()
Get configurations as
(field name, field value)pairs.- Returns:
- items
ItemsView Iterator of tuples for each configuration. Tuple items are:
Field name.
Field value.
- items
- keys()
Get field names.
- Returns:
- names
KeysView List of
lsst.pex.config.Fieldnames.
- names
- load(filename, root='config')
Modify this config in place by executing the Python code in a configuration file.
- Parameters:
- filename
lsst.resources.ResourcePathExpression Name of the configuration URI. A configuration file is a Python module. Since configuration files are Python code, remote URIs are not allowed.
- root
str, optional Name of the variable in file that refers to the config being overridden.
For example, the value of root is
"config"and the file contains:config.myField = 5
Then this config’s field
myFieldis set to5.
- filename
- loadFromStream(stream, root='config', filename=None, extraLocals=None)
Modify this Config in place by executing the Python code in the provided stream.
- Parameters:
- stream
typing.IO,str,bytes, orCodeType Stream containing configuration override code. If this is a code object, it should be compiled with
mode="exec".- root
str, optional Name of the variable in file that refers to the config being overridden.
For example, the value of root is
"config"and the file contains:config.myField = 5
Then this config’s field
myFieldis set to5.- filename
str, optional Name of the configuration file, or
Noneif unknown or contained in the stream. Used for error reporting and to set__file__variable in config.- extraLocals
dictofstrtoobject, optional Any extra variables to include in local scope when loading.
- stream
See also
Notes
For backwards compatibility reasons, this method accepts strings, bytes and code objects as well as file-like objects. New code should use
loadFromStringinstead for most of these types.
- loadFromString(code, root='config', filename=None, extraLocals=None)
Modify this Config in place by executing the Python code in the provided string.
- Parameters:
- code
str,bytes, orCodeType Stream containing configuration override code.
- root
str, optional Name of the variable in file that refers to the config being overridden.
For example, the value of root is
"config"and the file contains:config.myField = 5
Then this config’s field
myFieldis set to5.- filename
lsst.resources.ResourcePathExpression, optional URI of the configuration file, or
Noneif unknown or contained in the stream. Used for error reporting and to set__file__variable. Required to be set if the string config attempts to load other configs using either relative path or__file__.- extraLocals
dictofstrtoobject, optional Any extra variables to include in local scope when loading.
- code
- Raises:
- ValueError
Raised if a key in extraLocals is the same value as the value of the root argument.
- makePlot(data: MutableMapping[str, ndarray[tuple[Any, ...], dtype[_ScalarT]] | Scalar | HealSparseMap | Tensor | Mapping], plotInfo: Mapping[str, str], **kwargs) Figure
Make stellar locus plots using pre fitted values.
- Parameters:
- data
KeyedData The data to plot the points from, for more information please see the notes section.
- plotInfo
dict A dictionary of information about the data being plotted with keys:
- data
- Returns:
- fig
matplotlib.figure.Figure The resulting figure.
- fig
Notes
The axis labels are given by
self.xAxisLabelandself.yAxisLabel. The perpendicular distance of the points to the fit line is given in a histogram in the second panel.For the code to work it expects various quantities to be present in the
datathat it is given.The quantities that are expected to be present are:
- Statistics that are shown on the plot or used by the plotting code:
approxMagDepthThe approximate magnitude corresponding to the SN cut used.
f"{self.plotName}_sigmaMAD"The sigma mad of the distances to the line fit.
f"{self.plotName or ''}_median"The median of the distances to the line fit.
- Parameters from the fitting code that are illustrated on the plot:
"bFixed"The fixed intercept to fall back on.
"mFixed"The fixed gradient to fall back on.
"bODR"The intercept calculated by the final orthogonal distance regression fitting.
"mODR"The gradient calculated by the final orthogonal distance regression fitting.
"xMin`"The x minimum of the box used in the fit.
"xMax"The x maximum of the box used in the fit.
"yMin"The y minimum of the box used in the fit.
"yMax"The y maximum of the box used in the fit.
"mPerp"The gradient of the line perpendicular to the line from the second ODR fit.
"bPerpMin"The intercept of the perpendicular line that goes through xMin.
"bPerpMax"The intercept of the perpendicular line that goes through xMax.
"goodPoints"The points that passed the initial set of cuts (typically in fluxType S/N, extendedness, magnitude, and isfinite).
"fitPoints"The points use in the final fit.
- The main inputs to plot:
x, y, mag
Examples
An example of the plot produced from this code is here:
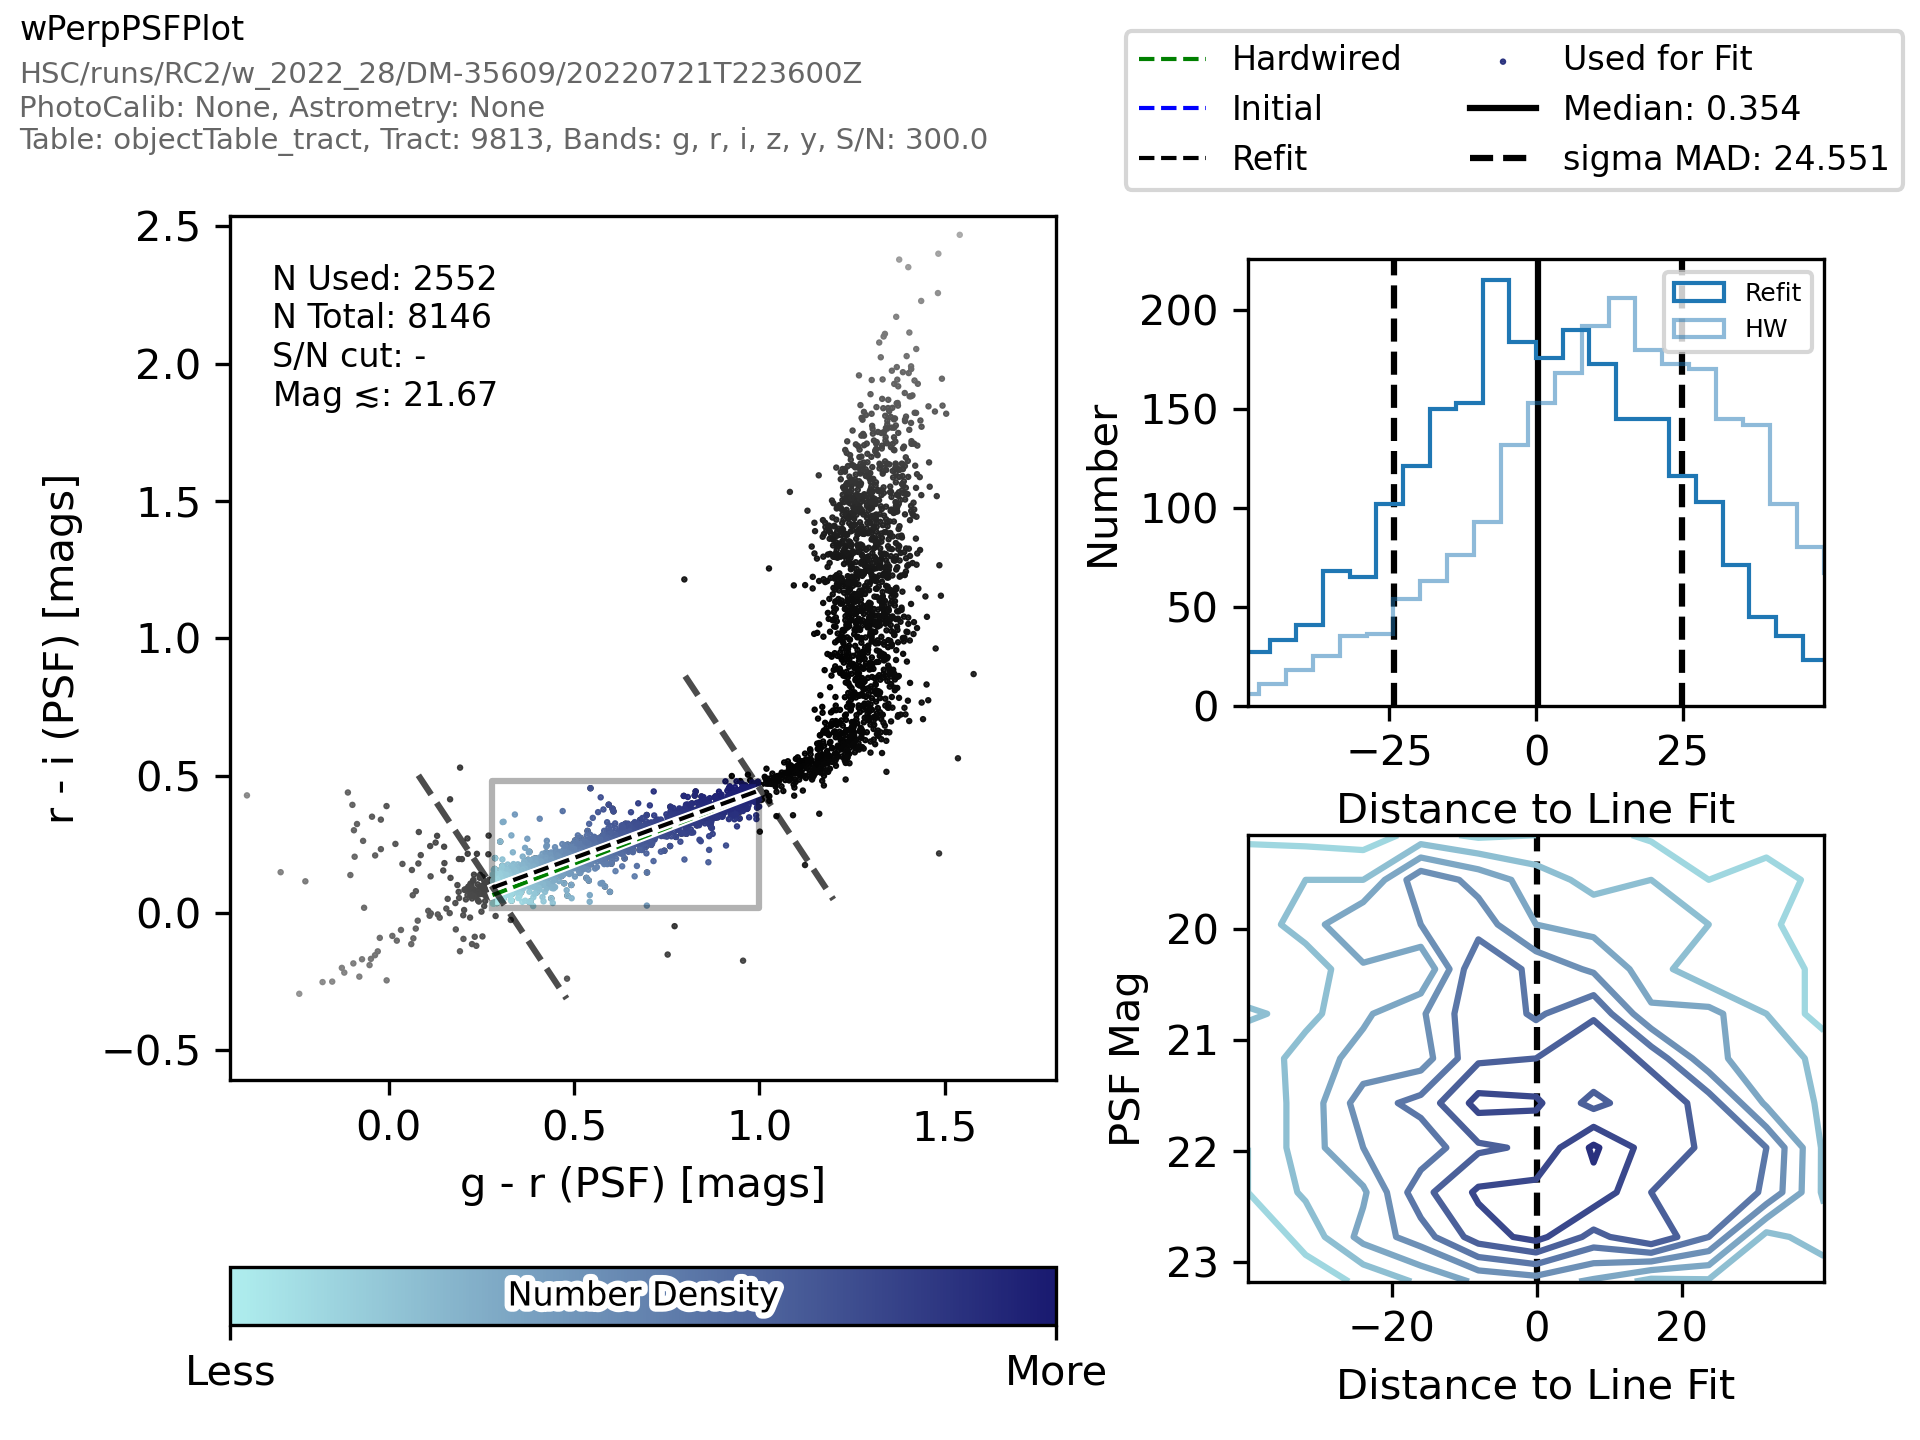
For a detailed example of how to make a plot from the command line please see the getting started guide.
- save(filename, root='config')
Save a Python script to the named file, which, when loaded, reproduces this config.
- Parameters:
- filename
str Desination filename of this configuration.
- root
str, optional Name to use for the root config variable. The same value must be used when loading (see
lsst.pex.config.Config.load).
- filename
- saveToStream(outfile, root='config', skipImports=False)
Save a configuration file to a stream, which, when loaded, reproduces this config.
- Parameters:
- outfile
typing.TextIO Destination file object write the config into. Accepts strings not bytes.
- root
str, optional Name to use for the root config variable. The same value must be used when loading (see
lsst.pex.config.Config.load).- skipImports
bool, optional If
Truethen do not includeimportstatements in output, this is to support human-oriented output frompipetaskwhere additional clutter is not useful.
- outfile
- saveToString(skipImports=False)
Return the Python script form of this configuration as an executable string.
- Parameters:
- Returns:
- code
str A code string readable by
loadFromString.
- code
- setDefaults()
Subclass hook for computing defaults.
Notes
Derived
Configclasses that must compute defaults rather than using theFieldinstances’s defaults should do so here. To correctly use inherited defaults, implementations ofsetDefaultsmust call their base class’ssetDefaults.
- toDict()
Make a dictionary of field names and their values.
See also
Notes
This method uses the
toDictmethod of individual fields. Subclasses ofFieldmay need to implement atoDictmethod for this method to work.
- update(**kw)
Update values of fields specified by the keyword arguments.
- Parameters:
- **kw
Keywords are configuration field names. Values are configuration field values.
Notes
The
__atand__labelkeyword arguments are special internal keywords. They are used to strip out any internal steps from the history tracebacks of the config. Do not modify these keywords to subvert aConfiginstance’s history.Examples
This is a config with three fields:
>>> from lsst.pex.config import Config, Field
>>> class DemoConfig(Config):
...     fieldA = Field(doc="Field A", dtype=int, default=42)
...     fieldB = Field(doc="Field B", dtype=bool, default=True)
...     fieldC = Field(doc="Field C", dtype=str, default="Hello world")
>>> config = DemoConfig()
These are the default values of each field:
>>> for name, value in config.iteritems():
...     print(f"{name}: {value}")
fieldA: 42
fieldB: True
fieldC: 'Hello world'
Using this method to update
fieldAandfieldC:>>> config.update(fieldA=13, fieldC="Updated!")
Now the values of each field are:
>>> for name, value in config.iteritems():
...     print(f"{name}: {value}")
fieldA: 13
fieldB: True
fieldC: 'Updated!'
- validate()
Validate the Config, raising an exception if invalid.
- Raises:
- lsst.pex.config.FieldValidationError
Raised if verification fails.
Notes
The base class implementation performs type checks on all fields by calling their
validatemethods.Complex single-field validation can be defined by deriving new Field types. For convenience, some derived
lsst.pex.config.Field-types (ConfigFieldandConfigChoiceField) are defined inlsst.pex.configthat handle recursing into subconfigs.Inter-field relationships should only be checked in derived
Configclasses after calling this method, and base validation is complete.
- values()
Get field values.
- Returns:
- values
ValuesView Iterator of field values.
- values