ScatterPlotWithTwoHists
- class lsst.analysis.tools.actions.plot.ScatterPlotWithTwoHists(*args, **kw)
Bases:
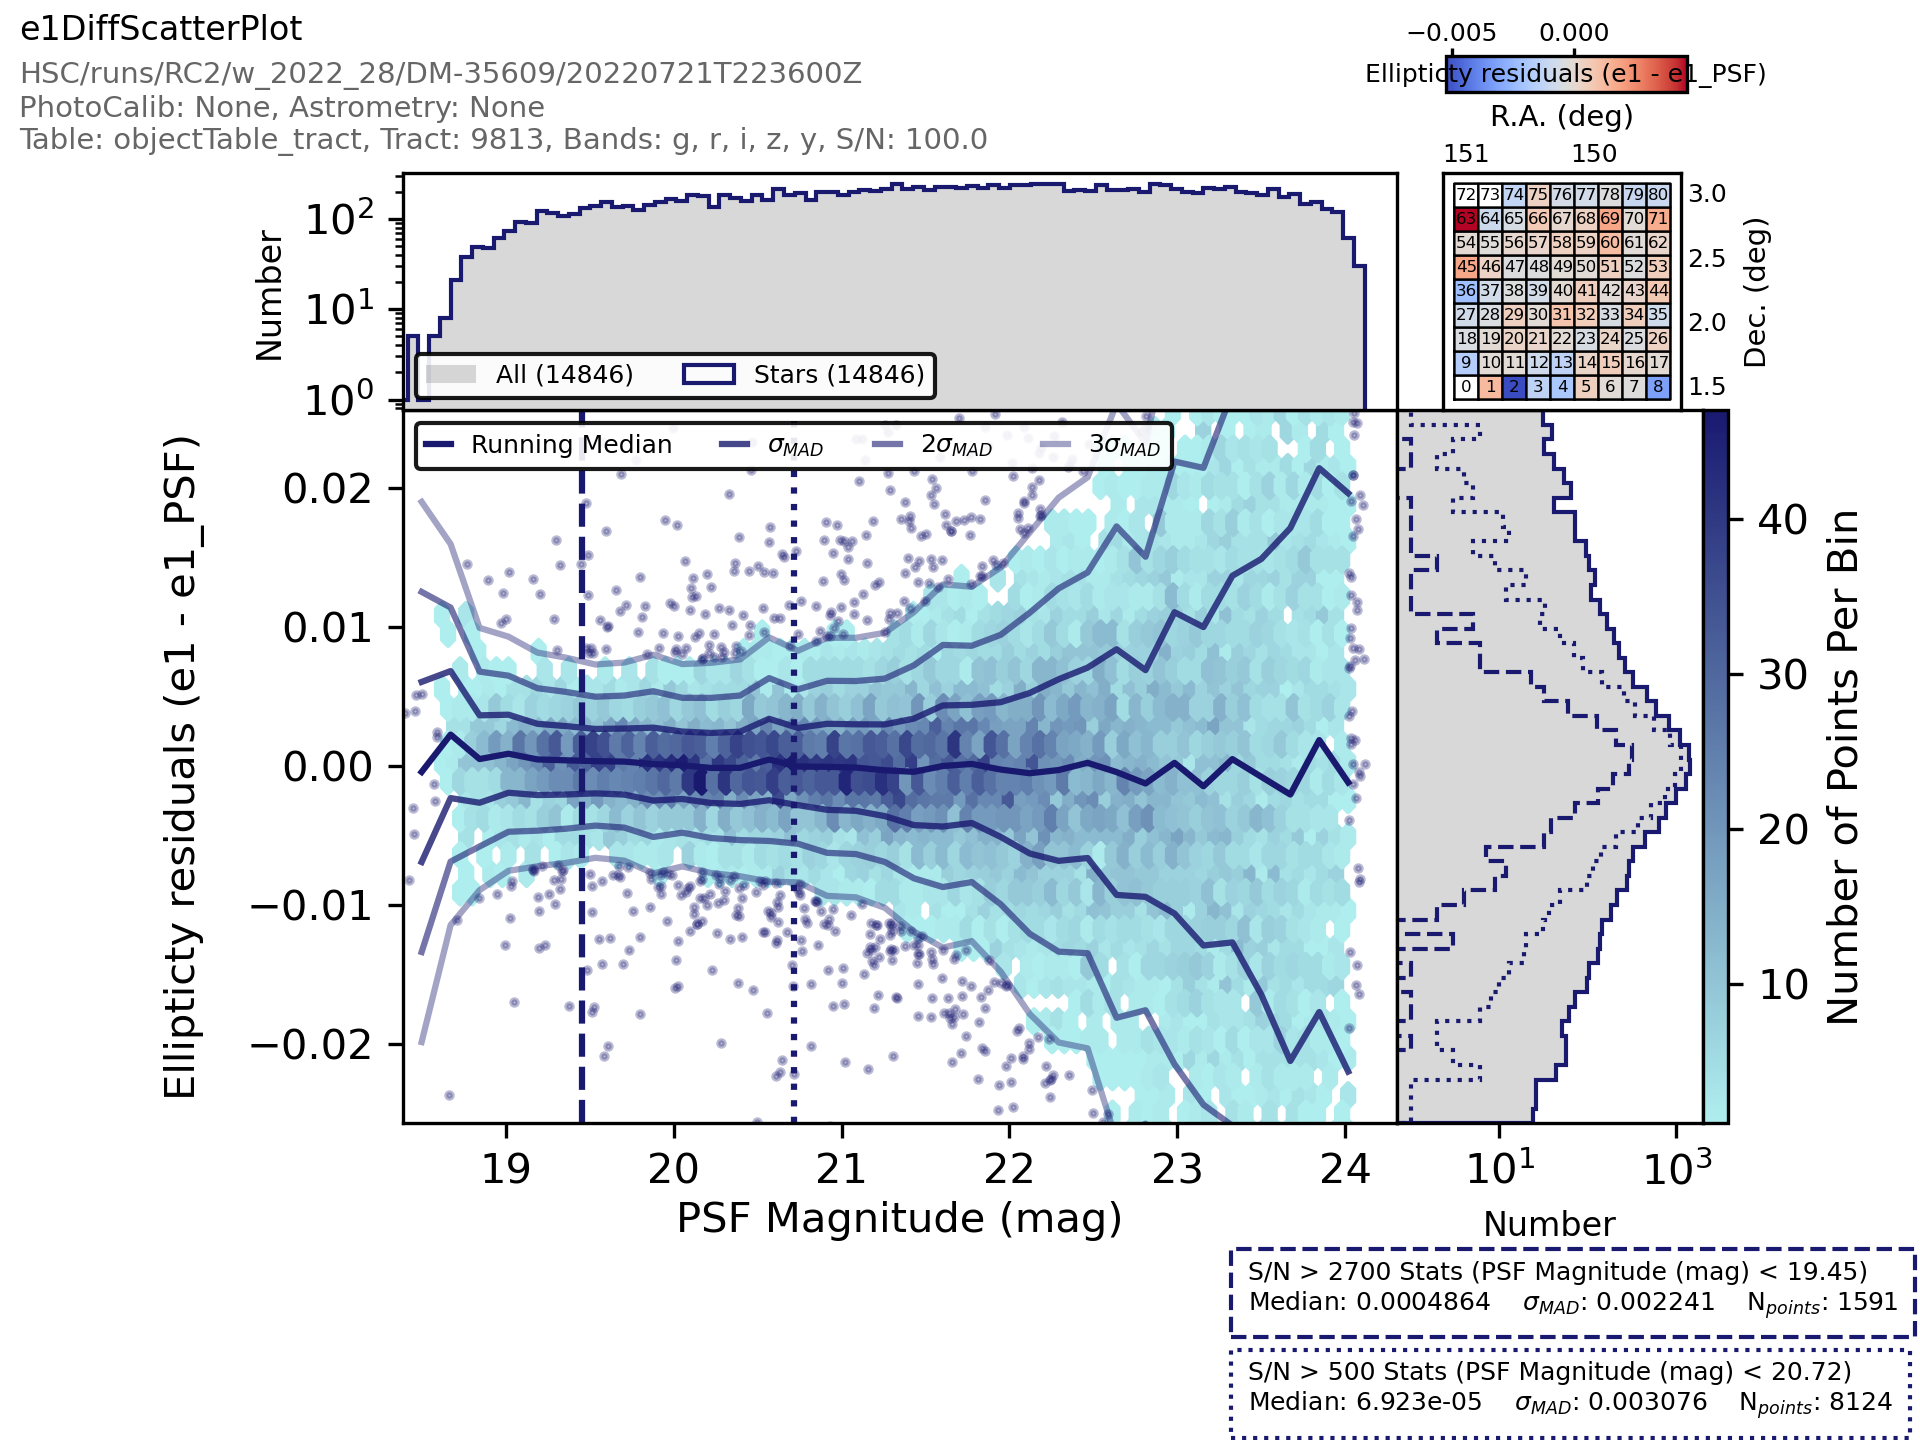
PlotActionMakes a scatter plot of the data with a marginal histogram for each axis.
Attributes Summary
Add a summary plot to the figure? (
bool, defaultTrue)Legend position within main plot (
str, default'upper left')Label to use for the magnitudes used for SNR (
str)Number of bins on x axis (
float, default40.0)Plot a 2D histogram in dense areas of points on the scatter plot.Doesn't look great if plotting multiple datasets on top of each other.
Selection of types of objects to plot.
Label to use for the x axis (
str)xlimits of the plot, if not specified determined from data (
List, defaultNone)Label to use for the y axis (
str)ylimits of the plot, if not specified determined from data (
List, defaultNone)Methods Summary
__call__(data, **kwargs)Call self as a function.
Return the schema an
AnalysisActionexpects to be present in the arguments supplied to the __call__ method.makePlot(data, skymap, plotInfo, **kwargs)Makes a generic plot with a 2D histogram and collapsed histograms of each axis.
Attributes Documentation
- plot2DHist
Plot a 2D histogram in dense areas of points on the scatter plot.Doesn’t look great if plotting multiple datasets on top of each other. (
bool, defaultTrue)
- plotTypes
Selection of types of objects to plot. Can take any combination of stars, galaxies, unknown, any (
List)
- xLims
xlimits of the plot, if not specified determined from data (
List, defaultNone)
- yLims
ylimits of the plot, if not specified determined from data (
List, defaultNone)
Methods Documentation
- __call__(data: MutableMapping[str, ndarray[Any, dtype[ScalarType]] | Scalar | HealSparseMap], **kwargs) Mapping[str, Figure] | Figure
Call self as a function.
- getInputSchema() HealSparseMap]]]
Return the schema an
AnalysisActionexpects to be present in the arguments supplied to the __call__ method.- Returns:
- result
KeyedDataSchema The schema this action requires to be present when calling this action, keys are unformatted.
- result
- makePlot(data: MutableMapping[str, ndarray[Any, dtype[ScalarType]] | Scalar | HealSparseMap], skymap: BaseSkyMap, plotInfo: Mapping[str, str], **kwargs) Figure
Makes a generic plot with a 2D histogram and collapsed histograms of each axis.
- Parameters:
- data
KeyedData The catalog to plot the points from.
- skymap
lsst.skymap.BaseSkyMap The skymap that gives the patch locations
- plotInfo
dict A dictionary of information about the data being plotted with keys:
- data
- Returns:
- fig
matplotlib.figure.Figure The resulting figure.
- fig
Notes
Uses the axisLabels config options
xandyand the axisAction config optionsxActionandyActionto plot a scatter plot of the values against each other. A histogram of the points collapsed onto each axis is also plotted. A summary panel showing the median of the y value in each patch is shown in the upper right corner of the resultant plot. The code uses the selectorActions to decide which points to plot and the statisticSelector actions to determine which points to use for the printed statistics.If this function is being used within the pipetask framework that takes care of making sure that data has all the required elements but if you are running this as a standalone function then you will need to provide the following things in the input data.
- If stars is in self.plotTypes:
xStars, yStars, starsHighSNMask, starsLowSNMask and {band}_highSNStars_{name}, {band}_lowSNStars_{name} where name is median, sigma_Mad, count and approxMag.
If it is for galaxies/unknowns then replace stars in the above names with galaxies/unknowns.
If it is for any (which covers all the points) then it becomes, x, y, and any instead of stars for the other parameters given above.
- In every case it is expected that data contains:
lowSnThreshold, highSnThreshold and patch (if the summary plot is being plotted).
Examples
An example of the plot produced from this code is here:

For a detailed example of how to make a plot from the command line please see the getting started guide.