

CompletenessHist#
- class lsst.analysis.tools.actions.plot.CompletenessHist(*args, **kw)#
Bases:
PlotActionMakes plots of completeness and purity.
Attributes Summary
Action to compute completeness/purity (
CalcCompletenessHistogramAction, default<class 'lsst.analysis.tools.actions.keyedData.calcCompletenessHistogram.CalcCompletenessHistogramAction'>)Color for the line showing object counts (
str, default'#029E73')Color for the line showing the correctly classified fraction (
str, default'#949494')Color for the line showing the wrongly classified fraction (
str, default'#DE8F05')Fraction of plot width to shift completeness/purity labels by.Ignored if percentiles_style is not 'below_line' (
float, default-0.1)Legend position within main plot (
str, default'lower left')Label for the completeness x axis.
Label for the purity x axis.
Label for measured objects (
str, default'Object')Style and locations for completeness threshold percentile labels (
str, default'below_line')Make a publication-style of plot (
bool, defaultFalse)Label for reference objects (
str, default'Reference')Whether to include a purity plot below completness (
bool, defaultTrue)Methods Summary
__call__(data, **kwargs)Call self as a function.
Return the schema an
AnalysisActionexpects to be present in the arguments supplied to the __call__ method.makePlot(data, plotInfo, **kwargs)Makes a plot showing the fraction of injected sources recovered by input magnitude.
Attributes Documentation
- action#
Action to compute completeness/purity (
CalcCompletenessHistogramAction, default<class 'lsst.analysis.tools.actions.keyedData.calcCompletenessHistogram.CalcCompletenessHistogramAction'>)
- color_counts#
Color for the line showing object counts (
str, default'#029E73')
- color_right#
Color for the line showing the correctly classified fraction (
str, default'#949494')
- color_wrong#
Color for the line showing the wrongly classified fraction (
str, default'#DE8F05')
- label_shift#
Fraction of plot width to shift completeness/purity labels by.Ignored if percentiles_style is not ‘below_line’ (
float, default-0.1)
- legendLocation#
Legend position within main plot (
str, default'lower left')
- mag_ref_label#
Label for the completeness x axis. (
str, default'{band}-band Reference Magnitude')
- mag_target_label#
Label for the purity x axis. (
str, default'{band}-band Measured Magnitude')
- object_label#
Label for measured objects (
str, default'Object')
- percentiles_style#
Style and locations for completeness threshold percentile labels (
str, default'below_line')Allowed values:
'above_plot'Labels in a semicolon-separated list above plot
'below_line'Labels under the horizontal part of each line
'None'Field is optional
- publicationStyle#
Make a publication-style of plot (
bool, defaultFalse)
- reference_label#
Label for reference objects (
str, default'Reference')
- show_purity#
Whether to include a purity plot below completness (
bool, defaultTrue)
Methods Documentation
- __call__(data: MutableMapping[str, ndarray[tuple[Any, ...], dtype[_ScalarT]] | Scalar | HealSparseMap | Tensor | Mapping], **kwargs) Mapping[str, Figure] | Figure#
Call self as a function.
- getInputSchema() Iterable[tuple[str, type[ndarray[tuple[Any, ...], dtype[_ScalarT]]] | type[Scalar] | type[HealSparseMap] | type[Tensor] | type[Mapping]]]#
Return the schema an
AnalysisActionexpects to be present in the arguments supplied to the __call__ method.Returns#
- result
KeyedDataSchema The schema this action requires to be present when calling this action, keys are unformatted.
- result
- makePlot(data, plotInfo, **kwargs)#
Makes a plot showing the fraction of injected sources recovered by input magnitude.
The behavior of this plot is controlled by
self.action. This action must be added to a struct (usually self.process.calculateActions) by the tool that calls this plot.Parameters#
- data
KeyedData All the data
- plotInfo
dict A dictionary of information about the data being plotted with keys:
cameraThe camera used to take the data (
lsst.afw.cameraGeom.Camera)"cameraName"The name of camera used to take the data (
str)."filter"The filter used for this data (
str)."ccdKey"The ccd/dectector key associated with this camera (
str)."visit"The visit of the data; only included if the data is from a single epoch dataset (
str)."patch"The patch that the data is from; only included if the data is from a coadd dataset (
str)."tract"The tract that the data comes from (
str)."photoCalibDataset"The dataset used for the calibration, e.g. “jointcal” or “fgcm” (
str)."skyWcsDataset"The sky Wcs dataset used (
str)."rerun"The rerun the data is stored in (
str).
Returns#
figThe figure to be saved (
matplotlib.figure.Figure).
Notes#
The behaviour of this plot is largel
Examples#
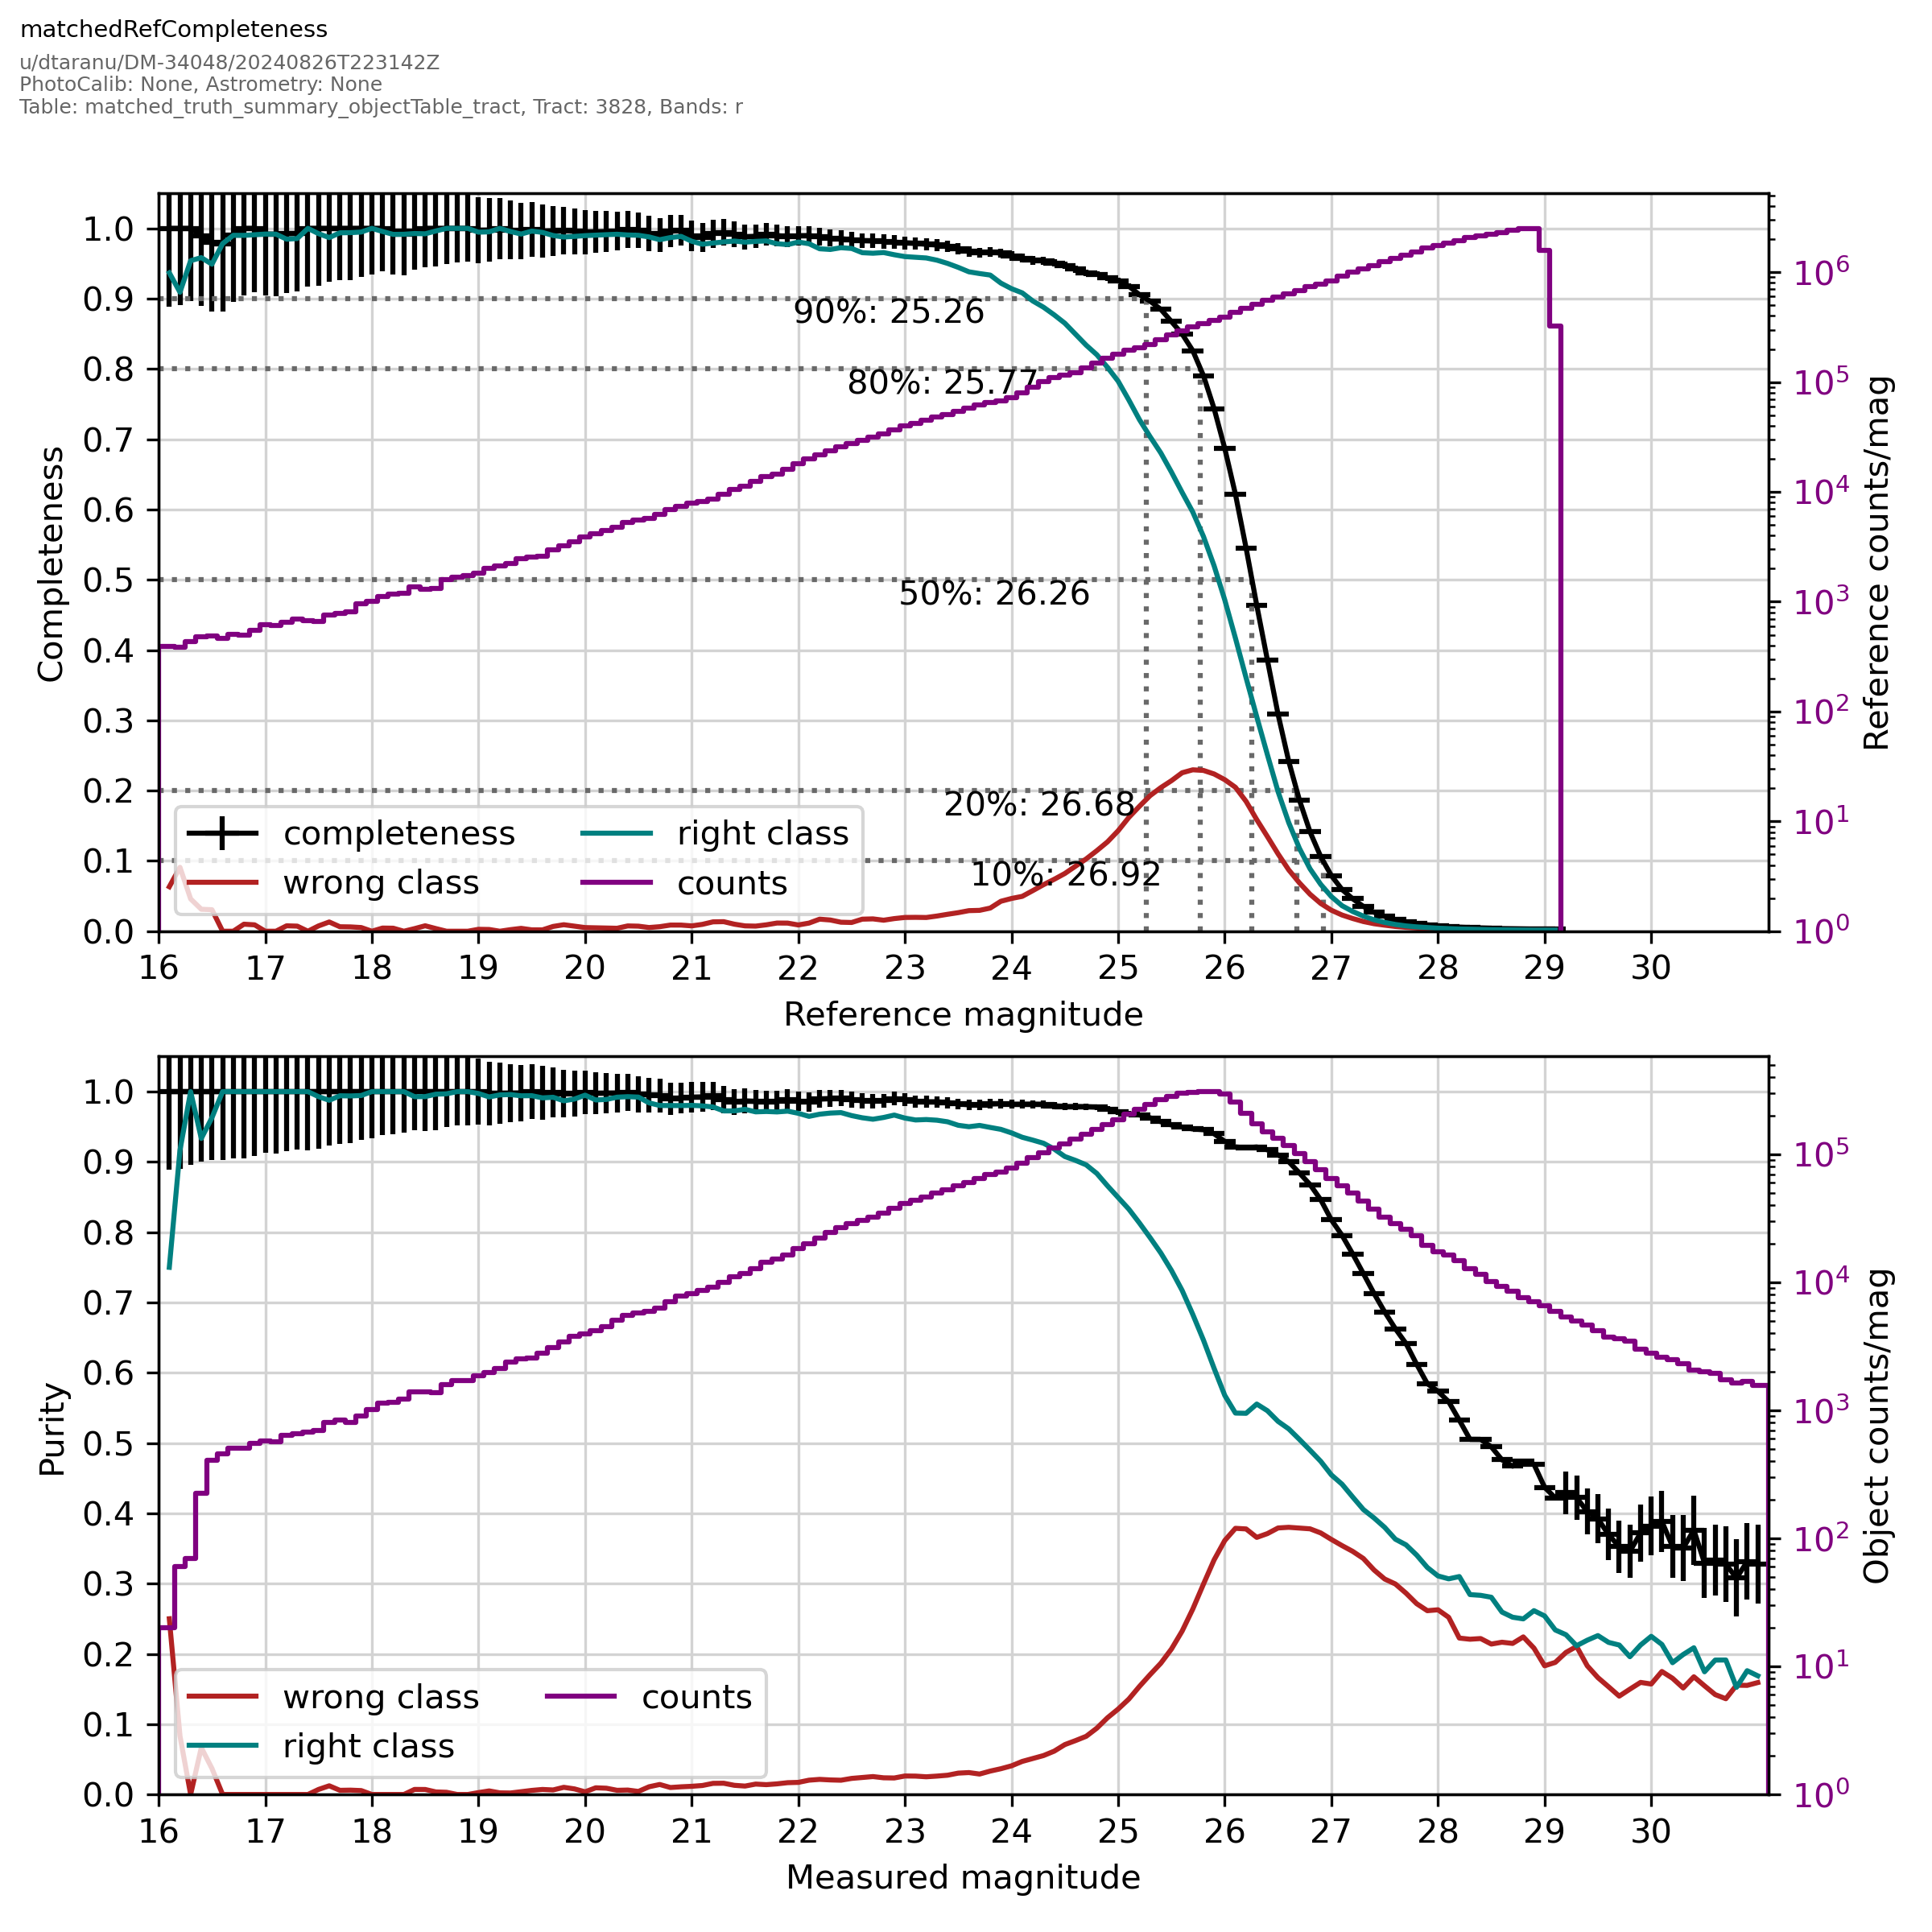
An example of the plot produced from this code from tract 3828 of the DC2 simulations is here:
- data