

HistPlot#
- class lsst.analysis.tools.actions.plot.HistPlot(*args, **kw)#
Bases:
PlotActionMake an N-panel plot with a configurable number of histograms displayed in each panel. Reference lines showing values of interest may also be added to each histogram. Panels are configured using the
HistPanelclass.Attributes Summary
Color map used for histogram lines.
A configurable dict describing the panels to be plotted, and the histograms for each panel.
Maximum number of histogram panels to place in each row.
Methods Summary
__call__(data, **kwargs)Call self as a function.
Return the schema an
AnalysisActionexpects to be present in the arguments supplied to the __call__ method.makePlot(data[, plotInfo])Make an N-panel plot with a user-configurable number of histograms displayed in each panel.
validate()Validate the Config, raising an exception if invalid.
Attributes Documentation
- cmap#
Color map used for histogram lines. All types available via
plt.cmmay be used. A number of custom color maps are also defined:newtab10,bright,vibrant. (str, default'rubin')
- panels#
A configurable dict describing the panels to be plotted, and the histograms for each panel. (
ConfigDict, default{})
- panelsPerRow#
Maximum number of histogram panels to place in each row. Set to 1 to stack panels vertically. (
int, default2)
Methods Documentation
- __call__(data: MutableMapping[str, ndarray[tuple[Any, ...], dtype[_ScalarT]] | Scalar | HealSparseMap | Tensor | Mapping], **kwargs) Mapping[str, Figure] | Figure#
Call self as a function.
- getInputSchema() Iterable[tuple[str, type[ndarray[tuple[Any, ...], dtype[_ScalarT]]] | type[Scalar] | type[HealSparseMap] | type[Tensor] | type[Mapping]]]#
Return the schema an
AnalysisActionexpects to be present in the arguments supplied to the __call__ method.Returns#
- result
KeyedDataSchema The schema this action requires to be present when calling this action, keys are unformatted.
- result
- makePlot(data: MutableMapping[str, ndarray[tuple[Any, ...], dtype[_ScalarT]] | Scalar | HealSparseMap | Tensor | Mapping], plotInfo: Mapping[str, str] = None, **kwargs) Figure#
Make an N-panel plot with a user-configurable number of histograms displayed in each panel.
Parameters#
- data
pandas.core.frame.DataFrame The catalog to plot the points from.
- plotInfo
dict - A dictionary of information about the data being plotted with keys:
"run"Output run for the plots (
str)."tractTableType"Table from which results are taken (
str)."plotName"Output plot name (
str)"SN"The global signal-to-noise data threshold (
float)"skymap"The type of skymap used for the data (
str)."tract"The tract that the data comes from (
int)."bands"The bands used for this data (
strorlist)."visit"The visit that the data comes from (
int)
Returns#
- fig
matplotlib.figure.Figure The resulting figure.
Examples#
An example histogram plot may be seen below:
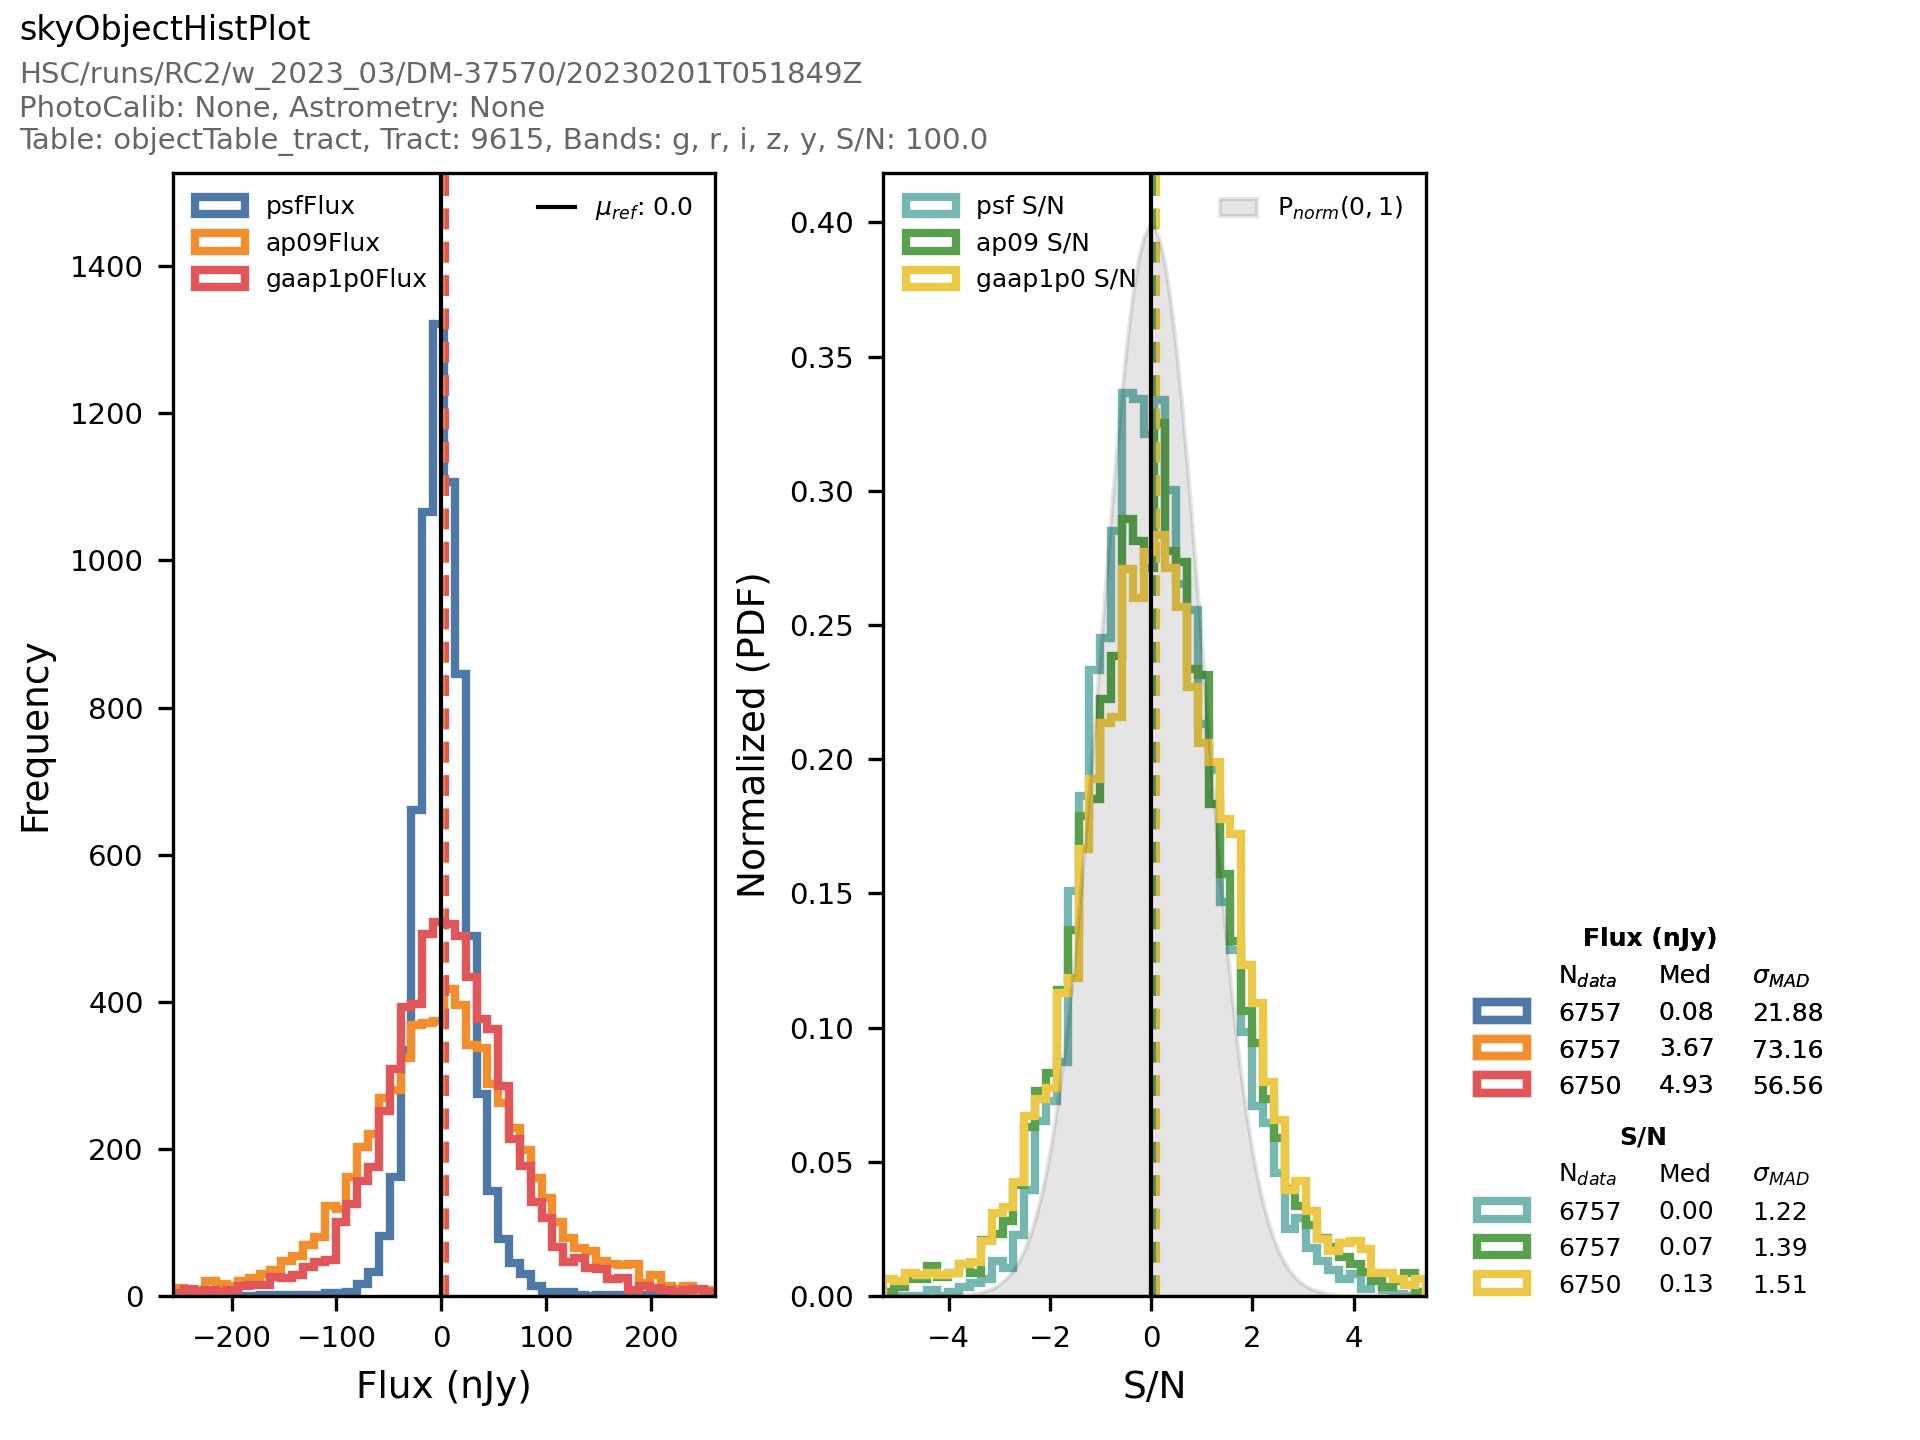
For further details on how to generate a plot, please refer to the getting started guide.
- data
- validate()#
Validate the Config, raising an exception if invalid.
Raises#
- lsst.pex.config.FieldValidationError
Raised if verification fails.
Notes#
The base class implementation performs type checks on all fields by calling their
validatemethods.Complex single-field validation can be defined by deriving new Field types. For convenience, some derived
lsst.pex.config.Field-types (ConfigFieldandConfigChoiceField) are defined inlsst.pex.configthat handle recursing into subconfigs.Inter-field relationships should only be checked in derived
Configclasses after calling this method, and base validation is complete.