PlotImageSubtractionCutoutsTask
PlotImageSubtractionCutoutsTask is a task to generate 3-image cutouts (template, science, difference) of difference image sources loaded from a catalog or APDB.
The output images can be uploaded to a Zooniverse project, or used for investigating difference imaging performance.
This task reads the images from a butler repo, and writes its output as individual PNG files to the directory passed to the run method, or specified on the commandline.
PlotImageSubtractionCutoutsTask is available on the command line as plotImageSubtractionCutouts.
Processing summary
PlotImageSubtractionCutoutsTask runs this sequence of operations:
For each source in the input data, read the template, science, and difference image.
Cutout a region on each of those images (size determined by the config).
Make an image containing those cutout regions.
Write the image as a PNG to the specified output directory, using the
diaSourceIdas the filename.
Python API summary
from lsst.analysis.ap.plotImageSubtractionCutouts import PlotImageSubtractionCutoutsTask
-
class
PlotImageSubtractionCutoutsTask(*, output_path, **kwargs) Generate template/science/difference image cutouts of DiaSources and an optional manifest for upload to a Zooniverse project
...
- attributeconfig
Access configuration fields and retargetable subtasks.
-
method
run(data, butler, njobs=0) Generate cutout images and a manifest for upload to Zooniverse from a collection of DiaSources
...
See also
See the PlotImageSubtractionCutoutsTask API reference for complete details.
Butler datasets
When run as the plotImageSubtractionCutouts command-line task, or directly through the runDataRef method, PlotImageSubtractionCutoutsTask obtains datasets from an input Butler data repository and a running APDB, but does not produce any output to the butler; the PNG image files are written to a specified directory.
Input datasets
*_warpedExpTemplate image that the template cutout is extracted from.
calexpScience image that the science cutout is extracted from.
*_differenceExpDifference image that the difference cutout is extracted from.
*_diaSrcDiaSource catalog measured on the difference image (used to load footprints when
use_footprint==True).
Output datasets
PlotImageSubtractionCutoutsTask writes its output as PNG images to a specified directory, with the DiaSourceId of each source used as that PNG name.
These images are all of the same size and ordered as: template, science, difference.
The template and science iamges are min/max scaled with an asinh stretch, while the difference image is on a zscale with a linear stretch.
An example cutout image is shown below, in the format that would be most commonly used for a Zooniverse upload.
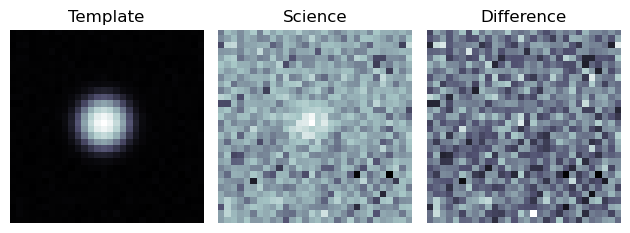
Figure 4 Basic image cutout, with no additional metadata.
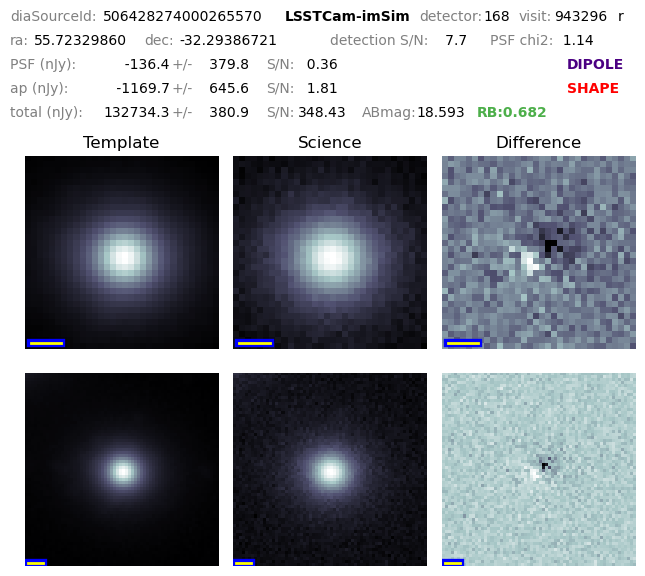
The two below examples show what is produced when the addMetadata config field is set.
The first image shows a mocked image with no catalog flags set.
The source id, instrument, detector, visit, and filter name are given on the top row.
The pixel scale in arcseconds/pixel is shown as a small bar in the lower-left corner of each image.
The PSF and ap flux fields are fluxes on the difference image, while the total flux field is the forced flux on the science image, and the AB magnitude computed from that forced flux.
Note that there is no colored text; this would represent a likely good difference image source measurement.
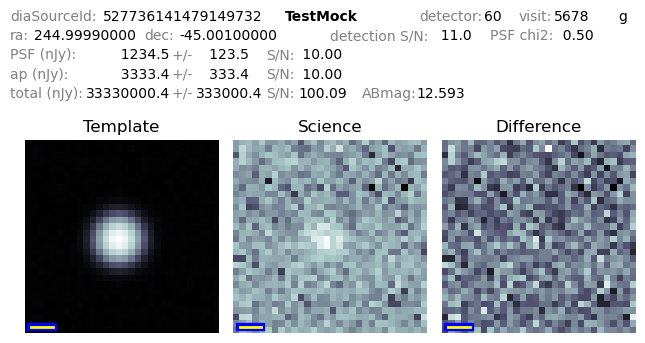
Figure 5 Cutout with metadata annotations, and no catalog flags set.
The second image shows a mocked image with all catalog flags set, representing a source with image and/or measurement problems.
The catalog flags are colored to match the Display mask plane colors.
The INTERP, SAT, CR, and SUS annotations are displayed if either that catalog flag, or the equivalent "*Center" flag is set (e.g. INTERP is displayed if either interpolated or interpolatedCenter is set).
Also note that the PSF, ap and total text labels are all in red: this signifies that the measurement algorithms for the PSF fit, aperture flux measurement, and forced PSF flux all had a flag set.
This example shows all flags set to showcase their positions and colors in the image.
In general, only a subset of these flags will be shown for any given source, but they will always be in the same position and color.
Detailed flag descriptions will eventually be available in the SDM Schema browser;
until then, look at data/association-flag-map.yaml in lsst.ap.association for more information on these flags.
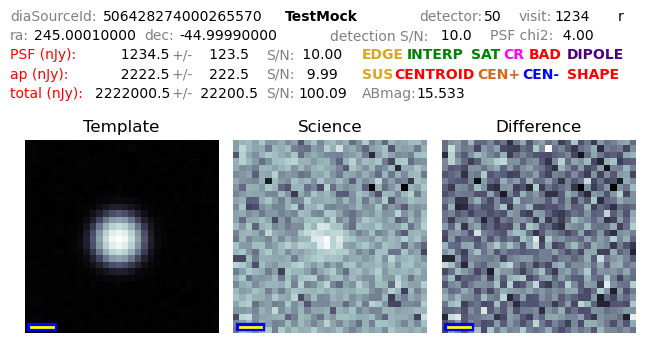
Figure 6 Cutout with metadata annotations, and all catalog flags set.
Generating Multi-size Cutouts
Multi-size cutouts can be generated by setting the config.sizes key.
The example image shown below contains cutouts of sizes 32x32 and 64x64 pixels.
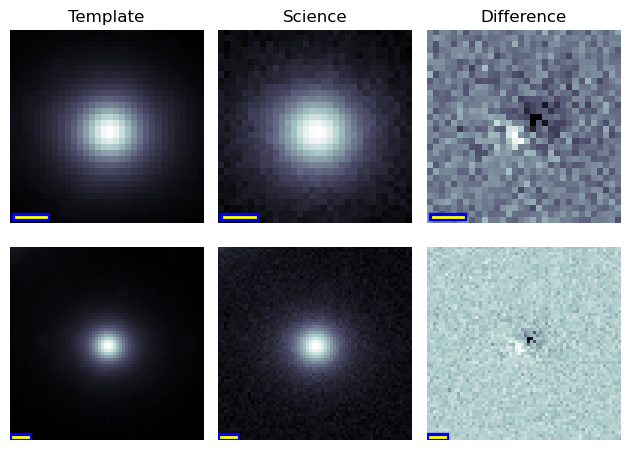
Figure 7 Multi-size image cutout, with no additional metadata.
Similarly, the image below shows an example of multi-size cutouts along with all catalog flags set.
This can be achieved by setting the config.add_metadata key to True.
Configuration fields
add_metadata
Annotate the cutouts with catalog metadata, including coordinates, fluxes, flags, etc.
chunk_size
Chunk up files into subdirectories, with at most this many files per directory. None means write all the files to one images/ directory.
diff_image_type
Optional partial dataset name of template and difference image to use for cutouts; will have ‘_templateExp’ and ‘_differenceExp’ appended for butler.get(), respectively. If not specified, use template_detector and difference_image, respectively.
save_as_numpy
Save the raw cutout images in numpy format.
science_image_type
Dataset type of science image to use for cutouts; older processings could be calexp or initial_pvi.
sizes
List of widths of cutout to extract for image from science, template, and difference exposures.
url_root
URL that the resulting images will be served to Zooniverse from, for the manifest file. If not set, no manifest file will be written.
use_footprint
Use source footprint to to define cutout region; If set, ignore size and use the footprint bbox instead.
Generating Image Cutouts
Image cutouts can be generated using the plotImageSubtractionCutouts task from analysis_ap. Note: To
have the required dataframe format, diaSources from the goodSeeingDiff_diaSrcTable must be used.
import lsst.daf.butler as dafButler
from lsst.analysis.ap import plotImageSubtractionCutouts

repo = '/repo/main'
collections = '/path/to/your/collection'
butler = dafButler.Butler(repo, collections=collections)

# Note that the outer double quotes and inner single quotes are required for the query to succeed.
where = "instrument='LSSTComCam' and skymap='lsst_cells_v1' and visit=2024120600049"
limit = 10

cutoutConfig = plotImageSubtractionCutouts.PlotImageSubtractionCutoutsConfig(science_image_type='initial_pvi')
cutoutTask = plotImageSubtractionCutouts.PlotImageSubtractionCutoutsTask(
    config=cutoutConfig, output_path='/your/output/path'
)

data_refs = butler.query_datasets(
    "goodSeeingDiff_diaSrcTable", where=where, limit=limit
)

for ref in data_refs:
    diaSourceTable = butler.get(ref)
    dv_diaSourceTable["instrument"] = "LSSTComCam"
    cutoutTask.run(diaSourceTable, butler)