Plot Types

This page lists the plot types provided by analysis_tools. The modules for these plots are all in python/lsst/analysis/tools/actions/plot and can all be found on GitHub.

lsst.analysis.tools.actions.plot Package

Classes

BarPlot(*args, **kw)

A plotting tool which can take multiple keyed data inputs and can create one or more bar graphs.

ColorColorFitPlot(*args, **kw)

Make a color-color plot and overplot a prefited line to the fit region.

DiaSkyPlot(*args, **kw)

Generic pseudo base class for plotting DiaSources (or DiaObjects) on the sky.

FocalPlaneGeometryPlot(*args, **kw)

Plots the focal plane distribution of a parameter in afw camera geometry units: amplifiers and detectors.

FocalPlanePlot(*args, **kw)

Plots the focal plane distribution of a parameter.

GridPanelConfig(*args, **kw)

GridPlot(*args, **kw)

Plot a series of plot elements onto a regularly spaced grid.

HistPlot(*args, **kw)

Make an N-panel plot with a configurable number of histograms displayed in each panel.

InterpolateDetectorMetricPlot(*args, **kw)

Interpolate metrics evaluated at locations across a detector.

MatrixPlot(*args, **kw)

Make the plot of a matrix (2D array).

Med2Mad(*args, **kw)

Return the median +/- 2*nansigmamad values of an input vector to use as the minimum and maximum values of a colorbar range.

MinMax(*args, **kw)

Return the maximum and minimum values of an input vector to use as the minimum and maximum values of a colorbar range.

MultiVisitCoveragePlot(*args, **kw)

Plot the coverage for a set of visits.

PropertyMapPlot(*args, **kw)

RhoStatisticsPlot(*args, **kw)

Make multiple plots of rho statistics.

ScatterPlotWithTwoHists(*args, **kw)

Makes a scatter plot of the data with a marginal histogram for each axis.

SkyPlot(*args, **kw)

Plots the on sky distribution of a parameter.

XYPlot(*args, **kw)

Make a plot (with errorbars) of one quantity (X) vs another (Y).

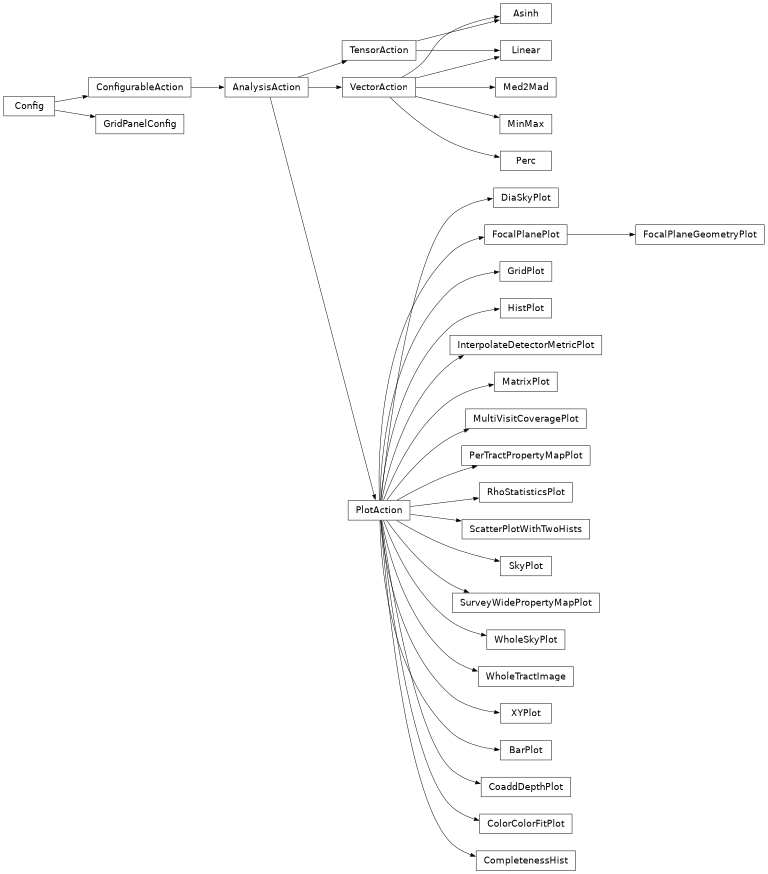
Class Inheritance Diagram

digraph inheritance6fa4e4c4cf { bgcolor=transparent; rankdir=LR; size="8.0, 12.0"; "AnalysisAction" [fillcolor=white,fontname="Vera Sans, DejaVu Sans, Liberation Sans, Arial, Helvetica, sans",fontsize=10,height=0.25,shape=box,style="setlinewidth(0.5),filled",tooltip="Base class interface for the various actions used in analysis tools."]; "ConfigurableAction" -> "AnalysisAction" [arrowsize=0.5,style="setlinewidth(0.5)"]; "BarPlot" [URL="../../../py-api/lsst.analysis.tools.actions.plot.BarPlot.html#lsst.analysis.tools.actions.plot.BarPlot",fillcolor=white,fontname="Vera Sans, DejaVu Sans, Liberation Sans, Arial, Helvetica, sans",fontsize=10,height=0.25,shape=box,style="setlinewidth(0.5),filled",target="_top",tooltip="A plotting tool which can take multiple keyed data inputs"]; "PlotAction" -> "BarPlot" [arrowsize=0.5,style="setlinewidth(0.5)"]; "ColorColorFitPlot" [URL="../../../py-api/lsst.analysis.tools.actions.plot.ColorColorFitPlot.html#lsst.analysis.tools.actions.plot.ColorColorFitPlot",fillcolor=white,fontname="Vera Sans, DejaVu Sans, Liberation Sans, Arial, Helvetica, sans",fontsize=10,height=0.25,shape=box,style="setlinewidth(0.5),filled",target="_top",tooltip="Make a color-color plot and overplot a prefited line to the fit region."]; "PlotAction" -> "ColorColorFitPlot" [arrowsize=0.5,style="setlinewidth(0.5)"]; "Config" [URL="../../../py-api/lsst.pex.config.Config.html#lsst.pex.config.Config",fillcolor=white,fontname="Vera Sans, DejaVu Sans, Liberation Sans, Arial, Helvetica, sans",fontsize=10,height=0.25,shape=box,style="setlinewidth(0.5),filled",target="_top",tooltip="Base class for configuration (*config*) objects."]; "ConfigurableAction" [URL="../../../py-api/lsst.pex.config.configurableActions.ConfigurableAction.html#lsst.pex.config.configurableActions.ConfigurableAction",fillcolor=white,fontname="Vera Sans, DejaVu Sans, Liberation Sans, Arial, Helvetica, sans",fontsize=10,height=0.25,shape=box,style="setlinewidth(0.5),filled",target="_top",tooltip="A `ConfigurableAction` is an interface that extends a"]; "Config" -> "ConfigurableAction" [arrowsize=0.5,style="setlinewidth(0.5)"]; "DiaSkyPlot" [URL="../../../py-api/lsst.analysis.tools.actions.plot.DiaSkyPlot.html#lsst.analysis.tools.actions.plot.DiaSkyPlot",fillcolor=white,fontname="Vera Sans, DejaVu Sans, Liberation Sans, Arial, Helvetica, sans",fontsize=10,height=0.25,shape=box,style="setlinewidth(0.5),filled",target="_top",tooltip="Generic pseudo base class for plotting DiaSources"]; "PlotAction" -> "DiaSkyPlot" [arrowsize=0.5,style="setlinewidth(0.5)"]; "FocalPlaneGeometryPlot" [URL="../../../py-api/lsst.analysis.tools.actions.plot.FocalPlaneGeometryPlot.html#lsst.analysis.tools.actions.plot.FocalPlaneGeometryPlot",fillcolor=white,fontname="Vera Sans, DejaVu Sans, Liberation Sans, Arial, Helvetica, sans",fontsize=10,height=0.25,shape=box,style="setlinewidth(0.5),filled",target="_top",tooltip="Plots the focal plane distribution of a parameter in afw camera"]; "FocalPlanePlot" -> "FocalPlaneGeometryPlot" [arrowsize=0.5,style="setlinewidth(0.5)"]; "FocalPlanePlot" [URL="../../../py-api/lsst.analysis.tools.actions.plot.FocalPlanePlot.html#lsst.analysis.tools.actions.plot.FocalPlanePlot",fillcolor=white,fontname="Vera Sans, DejaVu Sans, Liberation Sans, Arial, Helvetica, sans",fontsize=10,height=0.25,shape=box,style="setlinewidth(0.5),filled",target="_top",tooltip="Plots the focal plane distribution of a parameter."]; "PlotAction" -> "FocalPlanePlot" [arrowsize=0.5,style="setlinewidth(0.5)"]; "GridPanelConfig" [URL="../../../py-api/lsst.analysis.tools.actions.plot.GridPanelConfig.html#lsst.analysis.tools.actions.plot.GridPanelConfig",fillcolor=white,fontname="Vera Sans, DejaVu Sans, Liberation Sans, Arial, Helvetica, sans",fontsize=10,height=0.25,shape=box,style="setlinewidth(0.5),filled",target="_top"]; "Config" -> "GridPanelConfig" [arrowsize=0.5,style="setlinewidth(0.5)"]; "GridPlot" [URL="../../../py-api/lsst.analysis.tools.actions.plot.GridPlot.html#lsst.analysis.tools.actions.plot.GridPlot",fillcolor=white,fontname="Vera Sans, DejaVu Sans, Liberation Sans, Arial, Helvetica, sans",fontsize=10,height=0.25,shape=box,style="setlinewidth(0.5),filled",target="_top",tooltip="Plot a series of plot elements onto a regularly spaced grid."]; "PlotAction" -> "GridPlot" [arrowsize=0.5,style="setlinewidth(0.5)"]; "HistPlot" [URL="../../../py-api/lsst.analysis.tools.actions.plot.HistPlot.html#lsst.analysis.tools.actions.plot.HistPlot",fillcolor=white,fontname="Vera Sans, DejaVu Sans, Liberation Sans, Arial, Helvetica, sans",fontsize=10,height=0.25,shape=box,style="setlinewidth(0.5),filled",target="_top",tooltip="Make an N-panel plot with a configurable number of histograms displayed"]; "PlotAction" -> "HistPlot" [arrowsize=0.5,style="setlinewidth(0.5)"]; "InterpolateDetectorMetricPlot" [URL="../../../py-api/lsst.analysis.tools.actions.plot.InterpolateDetectorMetricPlot.html#lsst.analysis.tools.actions.plot.InterpolateDetectorMetricPlot",fillcolor=white,fontname="Vera Sans, DejaVu Sans, Liberation Sans, Arial, Helvetica, sans",fontsize=10,height=0.25,shape=box,style="setlinewidth(0.5),filled",target="_top",tooltip="Interpolate metrics evaluated at locations across a detector."]; "PlotAction" -> "InterpolateDetectorMetricPlot" [arrowsize=0.5,style="setlinewidth(0.5)"]; "MatrixPlot" [URL="../../../py-api/lsst.analysis.tools.actions.plot.MatrixPlot.html#lsst.analysis.tools.actions.plot.MatrixPlot",fillcolor=white,fontname="Vera Sans, DejaVu Sans, Liberation Sans, Arial, Helvetica, sans",fontsize=10,height=0.25,shape=box,style="setlinewidth(0.5),filled",target="_top",tooltip="Make the plot of a matrix (2D array)."]; "PlotAction" -> "MatrixPlot" [arrowsize=0.5,style="setlinewidth(0.5)"]; "Med2Mad" [URL="../../../py-api/lsst.analysis.tools.actions.plot.Med2Mad.html#lsst.analysis.tools.actions.plot.Med2Mad",fillcolor=white,fontname="Vera Sans, DejaVu Sans, Liberation Sans, Arial, Helvetica, sans",fontsize=10,height=0.25,shape=box,style="setlinewidth(0.5),filled",target="_top",tooltip="Return the median +/- 2*nansigmamad values of an input vector to use"]; "VectorAction" -> "Med2Mad" [arrowsize=0.5,style="setlinewidth(0.5)"]; "MinMax" [URL="../../../py-api/lsst.analysis.tools.actions.plot.MinMax.html#lsst.analysis.tools.actions.plot.MinMax",fillcolor=white,fontname="Vera Sans, DejaVu Sans, Liberation Sans, Arial, Helvetica, sans",fontsize=10,height=0.25,shape=box,style="setlinewidth(0.5),filled",target="_top",tooltip="Return the maximum and minimum values of an input vector to use as the"]; "VectorAction" -> "MinMax" [arrowsize=0.5,style="setlinewidth(0.5)"]; "MultiVisitCoveragePlot" [URL="../../../py-api/lsst.analysis.tools.actions.plot.MultiVisitCoveragePlot.html#lsst.analysis.tools.actions.plot.MultiVisitCoveragePlot",fillcolor=white,fontname="Vera Sans, DejaVu Sans, Liberation Sans, Arial, Helvetica, sans",fontsize=10,height=0.25,shape=box,style="setlinewidth(0.5),filled",target="_top",tooltip="Plot the coverage for a set of visits."]; "PlotAction" -> "MultiVisitCoveragePlot" [arrowsize=0.5,style="setlinewidth(0.5)"]; "PlotAction" [fillcolor=white,fontname="Vera Sans, DejaVu Sans, Liberation Sans, Arial, Helvetica, sans",fontsize=10,height=0.25,shape=box,style="setlinewidth(0.5),filled",tooltip="A `PlotAction` is an `AnalysisAction` that returns a `PlotType` or"]; "AnalysisAction" -> "PlotAction" [arrowsize=0.5,style="setlinewidth(0.5)"]; "PropertyMapPlot" [URL="../../../py-api/lsst.analysis.tools.actions.plot.PropertyMapPlot.html#lsst.analysis.tools.actions.plot.PropertyMapPlot",fillcolor=white,fontname="Vera Sans, DejaVu Sans, Liberation Sans, Arial, Helvetica, sans",fontsize=10,height=0.25,shape=box,style="setlinewidth(0.5),filled",target="_top"]; "PlotAction" -> "PropertyMapPlot" [arrowsize=0.5,style="setlinewidth(0.5)"]; "RhoStatisticsPlot" [URL="../../../py-api/lsst.analysis.tools.actions.plot.RhoStatisticsPlot.html#lsst.analysis.tools.actions.plot.RhoStatisticsPlot",fillcolor=white,fontname="Vera Sans, DejaVu Sans, Liberation Sans, Arial, Helvetica, sans",fontsize=10,height=0.25,shape=box,style="setlinewidth(0.5),filled",target="_top",tooltip="Make multiple plots of rho statistics."]; "PlotAction" -> "RhoStatisticsPlot" [arrowsize=0.5,style="setlinewidth(0.5)"]; "ScatterPlotWithTwoHists" [URL="../../../py-api/lsst.analysis.tools.actions.plot.ScatterPlotWithTwoHists.html#lsst.analysis.tools.actions.plot.ScatterPlotWithTwoHists",fillcolor=white,fontname="Vera Sans, DejaVu Sans, Liberation Sans, Arial, Helvetica, sans",fontsize=10,height=0.25,shape=box,style="setlinewidth(0.5),filled",target="_top",tooltip="Makes a scatter plot of the data with a marginal"]; "PlotAction" -> "ScatterPlotWithTwoHists" [arrowsize=0.5,style="setlinewidth(0.5)"]; "SkyPlot" [URL="../../../py-api/lsst.analysis.tools.actions.plot.SkyPlot.html#lsst.analysis.tools.actions.plot.SkyPlot",fillcolor=white,fontname="Vera Sans, DejaVu Sans, Liberation Sans, Arial, Helvetica, sans",fontsize=10,height=0.25,shape=box,style="setlinewidth(0.5),filled",target="_top",tooltip="Plots the on sky distribution of a parameter."]; "PlotAction" -> "SkyPlot" [arrowsize=0.5,style="setlinewidth(0.5)"]; "VectorAction" [fillcolor=white,fontname="Vera Sans, DejaVu Sans, Liberation Sans, Arial, Helvetica, sans",fontsize=10,height=0.25,shape=box,style="setlinewidth(0.5),filled",tooltip="A `VectorAction` is an `AnalysisAction` that returns a `Vector` when"]; "AnalysisAction" -> "VectorAction" [arrowsize=0.5,style="setlinewidth(0.5)"]; "XYPlot" [URL="../../../py-api/lsst.analysis.tools.actions.plot.XYPlot.html#lsst.analysis.tools.actions.plot.XYPlot",fillcolor=white,fontname="Vera Sans, DejaVu Sans, Liberation Sans, Arial, Helvetica, sans",fontsize=10,height=0.25,shape=box,style="setlinewidth(0.5),filled",target="_top",tooltip="Make a plot (with errorbars) of one quantity (X) vs another (Y)."]; "PlotAction" -> "XYPlot" [arrowsize=0.5,style="setlinewidth(0.5)"]; }