lsst.analysis.tools#
The Analysis Tools package is designed to assist in the creation of quality assurance (QA) plots and metrics from the outputs of a data reduction pipeline. The intention is that users have the flexibility to construct complex data analysis tasks from a set of simple building blocks. In this sense, a series of consistent, repeatable and high-quality plots and metrics can be generated for any given dataset.
Using Analysis Tools#
For a tutorial on working with
analysis_tools please see the getting started guide.
Need Help?#
The first place to check for more information is the FAQs page which contains some helpful hints. More will be added to this page over time; if you find something that you think should be added here then please do!
Project members and in-kind contributors may ask for further help via the #rubinobs-analysis-tools channel on the LSSTC Slack workspace.
All users of the analysis tools package, including community members, are also welcome to post any questions you might have on the Community Forum.
Contributing#
The lsst.analysis.tools package is developed at github.com/lsst/analysis_tools.
Jira issues relating to this package can be found using the analysis_tools component.
Script reference#
Python API Reference#
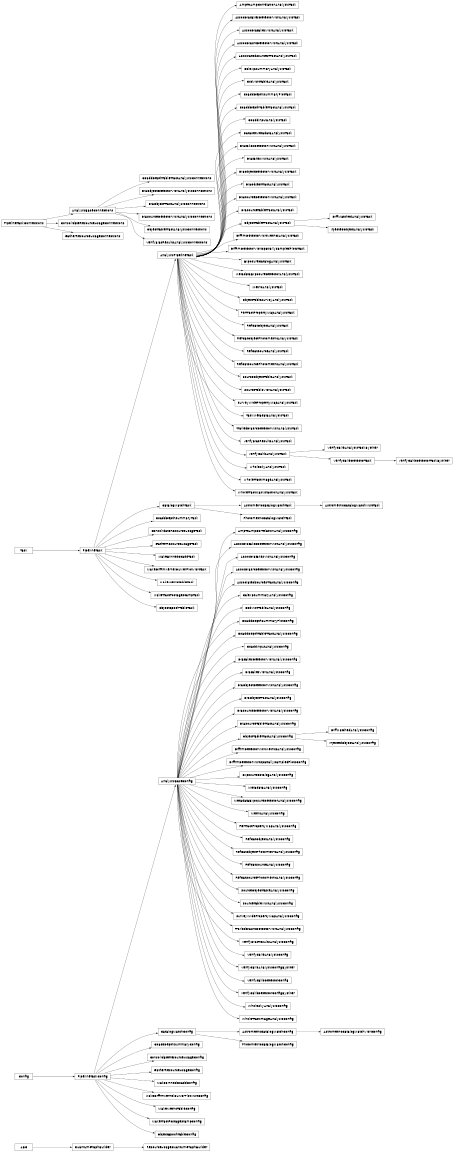
lsst.analysis.tools Package#
This package contains various analysis tools and the PipelineTasks which run them.
The primary tool in this package is the AnalysisTool class.
An AnalysisTool class has three stages: prep, process, and produce.
Creating a new AnalysisTool involves choosing (through configuration) one or
more AnalysisAction classes to run for each of those stages.
Both AnalysisTool and AnalysisAction are subclasses of the
ConfigurableAction class.
These objects are special types that are configured prior to any code
execution, and behave as functions at runtime.
The configuration state of a
ConfigurableAction is saved separately
from the object itself.
Functions#
|
Return the sqrt of values. |
|
Return dividend/divisor. |
|
Convert fluxes to magnitudes. |
|
Calculate the corners of a patch, given tractInfo. |
|
Calculate the corners of a tract, given a skymap. |
Creates a requests session with a custom transport to support automatic retries with backoff for dealing with transient server-side issues. |
|
|
Return true if the value is between 0-100 |
|
Return the max of a vector. |
|
Return the mean of a vector. |
|
Return the median of a vector. |
|
Return the max of a vector. |
|
Return the sigma_MAD of a vector. |
|
|
|
Return the sqrt of values. |
|
|
|
Return the sin of values. |
|
Return the sqrt of values. |
Variables#
str(object='') -> str str(bytes_or_buffer[, encoding[, errors]]) -> str |
|
str(object='') -> str str(bytes_or_buffer[, encoding[, errors]]) -> str |
|
str(object='') -> str str(bytes_or_buffer[, encoding[, errors]]) -> str |
|
str(object='') -> str str(bytes_or_buffer[, encoding[, errors]]) -> str |
|
str(object='') -> str str(bytes_or_buffer[, encoding[, errors]]) -> str |
|
str(object='') -> str str(bytes_or_buffer[, encoding[, errors]]) -> str |
|
str(object='') -> str str(bytes_or_buffer[, encoding[, errors]]) -> str |
|
str(object='') -> str str(bytes_or_buffer[, encoding[, errors]]) -> str |
|
str(object='') -> str str(bytes_or_buffer[, encoding[, errors]]) -> str |
|
str(object='') -> str str(bytes_or_buffer[, encoding[, errors]]) -> str |
|
str(object='') -> str str(bytes_or_buffer[, encoding[, errors]]) -> str |
|
str(object='') -> str str(bytes_or_buffer[, encoding[, errors]]) -> str |
|
str(object='') -> str str(bytes_or_buffer[, encoding[, errors]]) -> str |
|
str(object='') -> str str(bytes_or_buffer[, encoding[, errors]]) -> str |
|
str(object='') -> str str(bytes_or_buffer[, encoding[, errors]]) -> str |
|
str(object='') -> str str(bytes_or_buffer[, encoding[, errors]]) -> str |
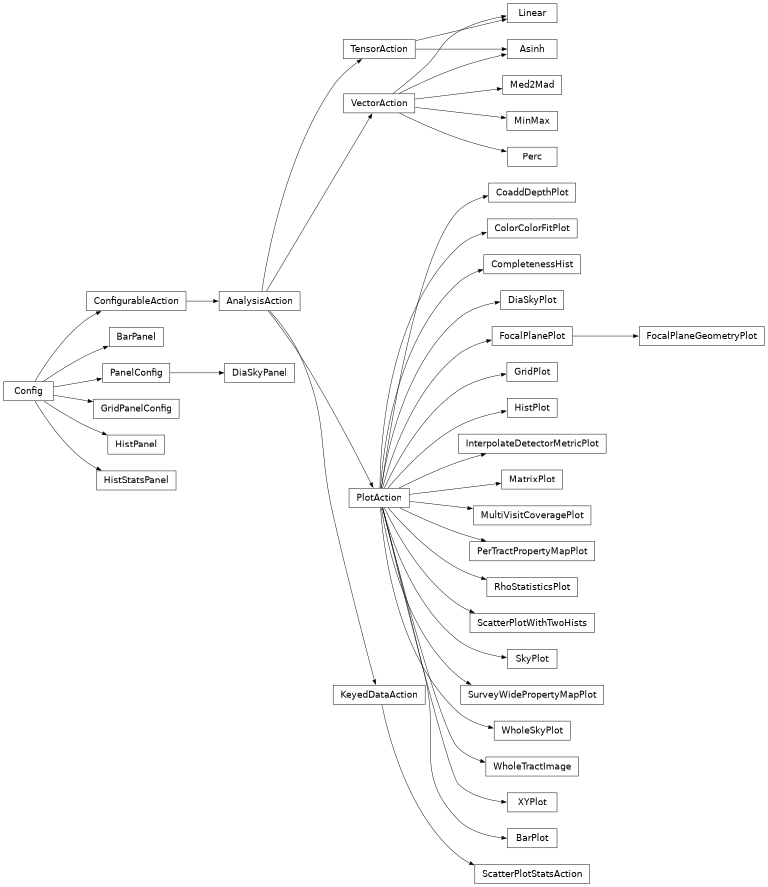
lsst.analysis.tools.actions.plot Package#
Classes#
|
Transform the input vector/tensor using the asinh stretch. |
|
A configurable class describing a panel in a bar plot. |
|
A plotting tool which can take multiple keyed data inputs and can create one or more bar graphs. |
|
Make a plot of pixels per coadd depth. |
|
Make a color-color plot and overplot a prefited line to the fit region. |
|
Makes plots of completeness and purity. |
|
Configuration options for DiaSkyPlot panels. |
|
Generic pseudo base class for plotting DiaSources (or DiaObjects) on the sky. |
|
Plots the focal plane distribution of a parameter in afw camera geometry units: amplifiers and detectors. |
|
Plots the focal plane distribution of a parameter. |
|
|
|
Plot a series of plot elements onto a regularly spaced grid. |
|
A Config class that holds parameters to configure a single panel of a histogram plot. |
|
Make an N-panel plot with a configurable number of histograms displayed in each panel. |
|
A Config class that holds parameters to configure a the stats panel shown for histPlot. |
|
Interpolate metrics evaluated at locations across a detector. |
|
Transform the input vector/tensor using the linear stretch. |
|
Make the plot of a matrix (2D array). |
|
Return the median +/- 2*nansigmamad values of an input vector to use as the minimum and maximum values of a colorbar range. |
|
Return the maximum and minimum values of an input vector to use as the minimum and maximum values of a colorbar range. |
|
Plot the coverage for a set of visits. |
|
|
|
Return the minimum and maximum values of an input vector after excluding a fraction of values from either end of the distribution. |
|
Make multiple plots of rho statistics. |
|
Calculates the statistics needed for the scatter plot with two hists. |
|
Makes a scatter plot of the data with a marginal histogram for each axis. |
|
Plots the on sky distribution of a parameter. |
|
|
|
Plots the on sky distribution of a parameter. |
|
Produces a figure displaying whole-tract coadd pixel data as a 2D image. |
|
Make a plot (with errorbars) of one quantity (X) vs another (Y). |
Class Inheritance Diagram#
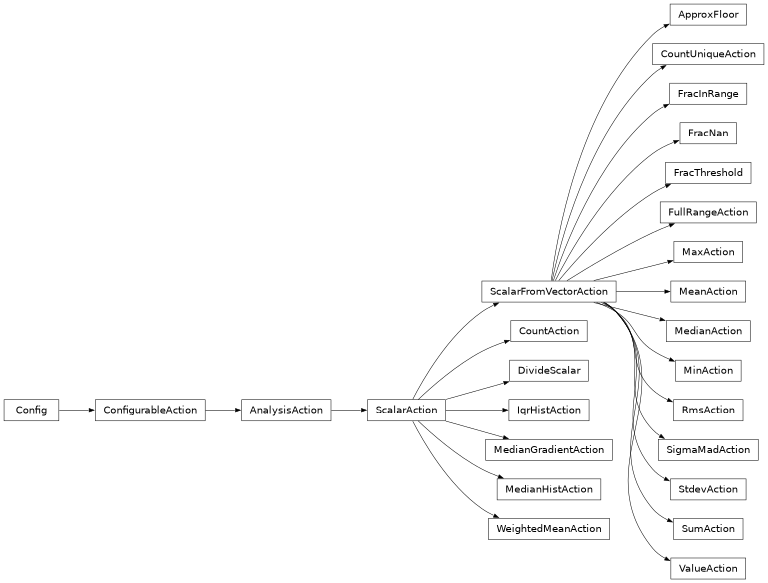
lsst.analysis.tools.actions.scalar Package#
Classes#
|
Returns the median of the lowest ten values of the sorted input. |
|
Performs count actions, with threshold-based filtering. |
|
Counts the number of unique rows in a given column. |
|
Calculate (A/B) for scalars. |
|
Compute the fraction of a distribution that is between specified minimum and maximum values, and is not NaN. |
|
Compute the fraction of vector entries that are NaN. |
|
Compute the fraction of a distribution above or below a threshold. |
|
Returns the full range (i.e., max-min) of the given data. |
|
Calculates the interquartile range of the given histogram data. |
|
Returns the maximum of the given data. |
|
Calculates the mean of the given data. |
|
Calculates the median of the given data. |
|
Calculate the gradient of a running median |
|
Calculates the median of the given histogram data. |
|
Returns the minimum of the given data. |
|
Calculates the root mean square of the given data (without subtracting the mean as in StdevAction). |
|
Calculates the sigma mad of the given data. |
|
Calculates the standard deviation of the given data. |
|
Returns the sum of all values in the column. |
|
Extracts the first value from a vector. |
|
Calculates the weighted mean of a vector using a second vector as weights. |
Class Inheritance Diagram#
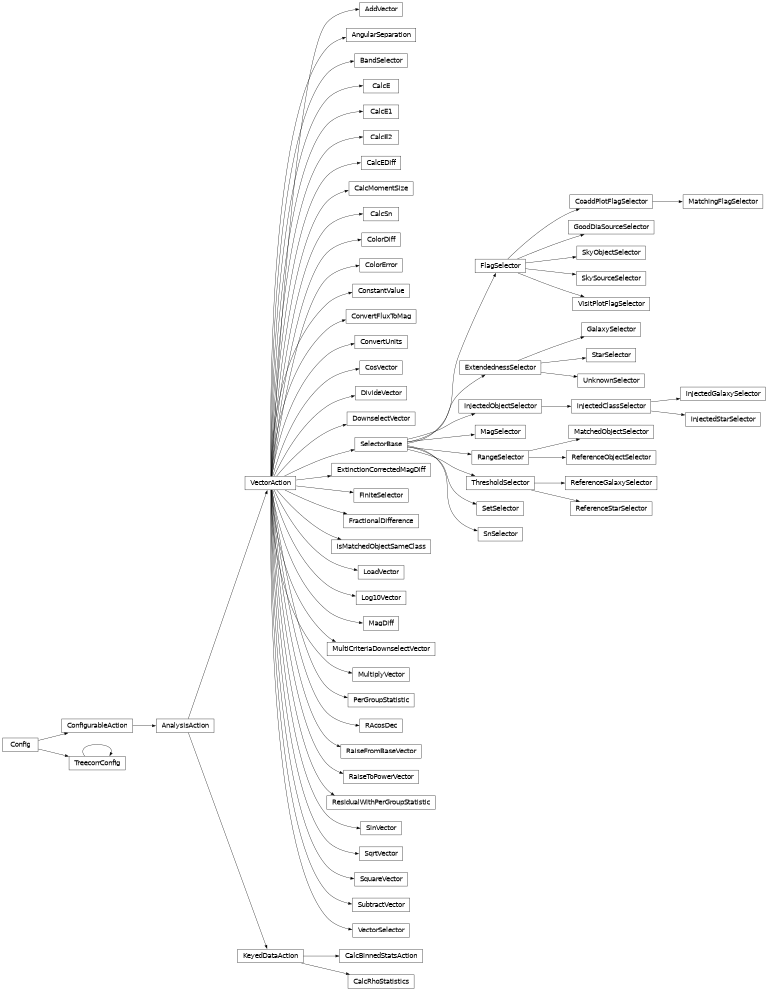
lsst.analysis.tools.actions.vector Package#
Classes#
|
Calculate (A+B). |
|
Calculate the angular separation between two coordinate positions. |
|
Makes a mask for sources observed in a specified set of bands. |
|
|
|
Calculate a complex value representation of the ellipticity. |
|
Calculate \(e_1\) (distortion-type) or \(g_1\) (shear-type). |
|
Calculate \(e_2\) (distortion-type) or \(g_2\) (shear-type). |
|
Calculate the difference of two ellipticities as a complex quantity. |
|
Calculate a size based on 2D moments. |
|
Calculate rho statistics. |
|
Calculate the signal-to-noise ratio from a single flux vector. |
|
This default setting makes it take the band from the kwargs. |
|
Calculate the difference between two colors from flux actions. |
|
Calculate the error in a color from two different flux error columns. |
|
Return a constant scalar value. |
|
Turn nanojanskys into magnitudes. |
|
Convert the units of a vector. |
|
Calculate cos(A) |
|
Calculate (A/B) |
|
Get a vector from KeyedData, apply specified selector, return the shorter Vector. |
|
A selector that picks between extended and point sources. |
|
Compute the difference between two magnitudes and correct for extinction By default bands are derived from the <band>_ prefix on flux columns, per the naming convention in the Object Table: e.g. the band of 'g_psfFlux' is 'g'. |
|
Return a mask of finite values for a vector key |
|
The base flag selector to use to select valid sources for QA. |
|
Calculate (A-B)/B. |
|
A selector that picks out galaxies based off of their extendedness values. |
|
Selects good DIA sources from diaSourceTables. |
|
A selector for injected objects of a given class. |
|
A selector for injected galaxies. |
|
A selector for injected objects. |
|
A selector for injected stars. |
|
Action to return whether matched objects are the same class. |
|
Load and return a Vector from KeyedData. |
|
Calculate log10(A) |
|
Calculate the difference between two magnitudes; each magnitude is derived from a flux column. |
|
Selects points that have minMag < mag (AB) < maxMag. |
|
A selector that selects matched objects with finite distances. |
|
The default flag selector to apply pre matching. |
|
Get a vector from KeyedData, apply specified set of selectors with AND logic, and return the shorter Vector. |
|
Calculate (A*B) |
|
Compute per-group statistic values and return result as a vector with one element per group. |
|
Construct a vector of RA*cos(Dec) in order to have commensurate values between RA and Dec. |
|
Calculate n**A |
|
Calculate A**n |
|
Selects rows within a range, inclusive of min/exclusive of max. |
|
A selector that selects galaxies from a catalog with a boolean column identifying unresolved sources. |
|
A selector that selects all objects from a catalog with a boolean column identifying unresolved sources. |
|
A selector that selects stars from a catalog with a boolean column identifying unresolved sources. |
|
Compute residual between individual elements of group and the per-group statistic. |
|
|
|
Selects rows with any number of column values within a given set. |
|
Calculate sin(A) |
|
Selects sky objects in the given band(s). |
|
Selects sky sources from sourceTables. |
|
Selects points that have S/N > threshold in the given flux type. |
|
Calculate sqrt(A) |
|
Calculate A**2 |
|
A selector that picks out stars based off of their extendedness values. |
|
Calculate (A-B). |
|
Return a mask corresponding to an applied threshold. |
|
|
|
A selector that picks out unclassified objects based off of their extendedness values. |
|
Load a boolean vector from KeyedData and return it for use as a selector. |
|
Select on a set of flags appropriate for making visit-level plots (i.e., using sourceTable_visit catalogs). |
Class Inheritance Diagram#
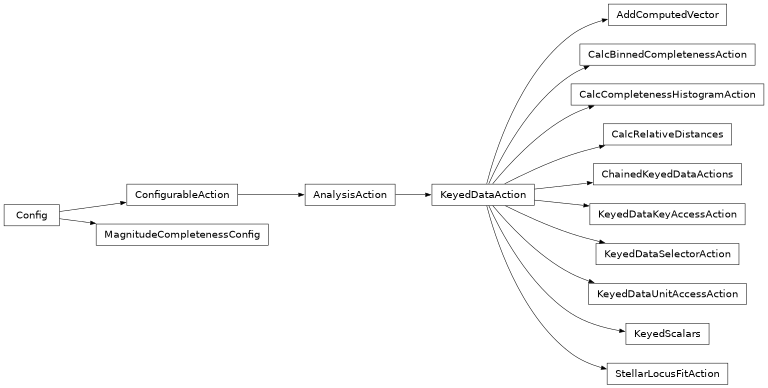
lsst.analysis.tools.actions.keyedData Package#
Classes#
|
Compute a |
|
Calculate completeness and purity in a single magnitude bin. |
|
Action to calculate a histogram of completeness vs magnitude. |
|
Calculate relative distances in a matched catalog. |
|
Run a series of |
|
Fetches the value for a given top-level key in a KeyedData. |
|
Extract Vector specified by |
|
Fetches the unit for a given key in a KeyedData as a string. |
|
Creates an output of type KeyedData, where the keys are given by the identifiers in |
|
Configuration for measuring magnitudes at given completeness thresholds. |
|
Determine Stellar Locus fit parameters from given input |
Class Inheritance Diagram#
lsst.analysis.tools.tasks Package#
Classes#
|
|
|
Task to analyze the correlation between amplifier biases. |
|
|
|
|
|
|
|
|
|
|
|
|
|
|
|
Match a tract-level catalog to a reference catalog |
|
|
|
Match a visit-level catalog to a reference catalog |
|
|
|
|
|
|
|
The base task for matching catalogs. |
|
|
|
|
|
|
|
|
|
|
|
|
|
|
|
|
|
|
|
|
|
Construct a table containing the visit and detector IDs of all PVIs that the butler believes could potentially have gone into a coadd. |
|
Configuration definitions for |
|
Connection definitions for |
|
A |
|
|
|
|
|
|
|
|
|
|
|
|
|
|
|
|
|
|
|
|
|
|
|
|
|
|
|
|
|
|
|
|
|
|
|
An |
|
Configuration definitions for |
|
Connection definitions for |
|
A |
|
|
|
Make plots and metrics using a table of measured objects matched to injected inputs. |
|
Config for MakeBinnedCoaddTask |
|
|
|
|
|
|
|
|
|
Turn metric bundles and combine them into a metric table. |
|
|
|
|
|
|
|
|
|
|
|
Take a metric table and run an analysis tool on the data it contains. |
|
|
|
Collect mean epochs for the observations that went into each object. |
|
A specialized |
|
|
|
|
|
|
|
|
|
|
|
|
|
A wrapper task to provide the information that is specific to the photometric reference catalog. |
|
|
|
Make plots and metrics using a table of objects matched to reference catalog sources. |
|
|
|
Make plots and metrics using a table of objects matched to photometric reference catalog sources. |
|
|
|
Make plots and metrics using a table of objects matched to reference catalog sources. |
|
|
|
Make plots and metrics using a table of objects matched to photometric reference catalog sources. |
|
Custom quantum graph generator and pipeline builder for resource usage summary tasks. |
|
|
|
|
|
|
|
|
|
|
|
|
|
|
|
|
|
|
|
|
|
|
|
|
|
|
|
|
|
|
|
|
|
|
|
|
|
|
|
|
|
|
|
|
|
|
|
Computes per-patch mask plane pixel fractions. |
Class Inheritance Diagram#