

RhoStatisticsPlot#
- class lsst.analysis.tools.actions.plot.RhoStatisticsPlot(*args, **kw)#
Bases:
PlotActionMake multiple plots of rho statistics.
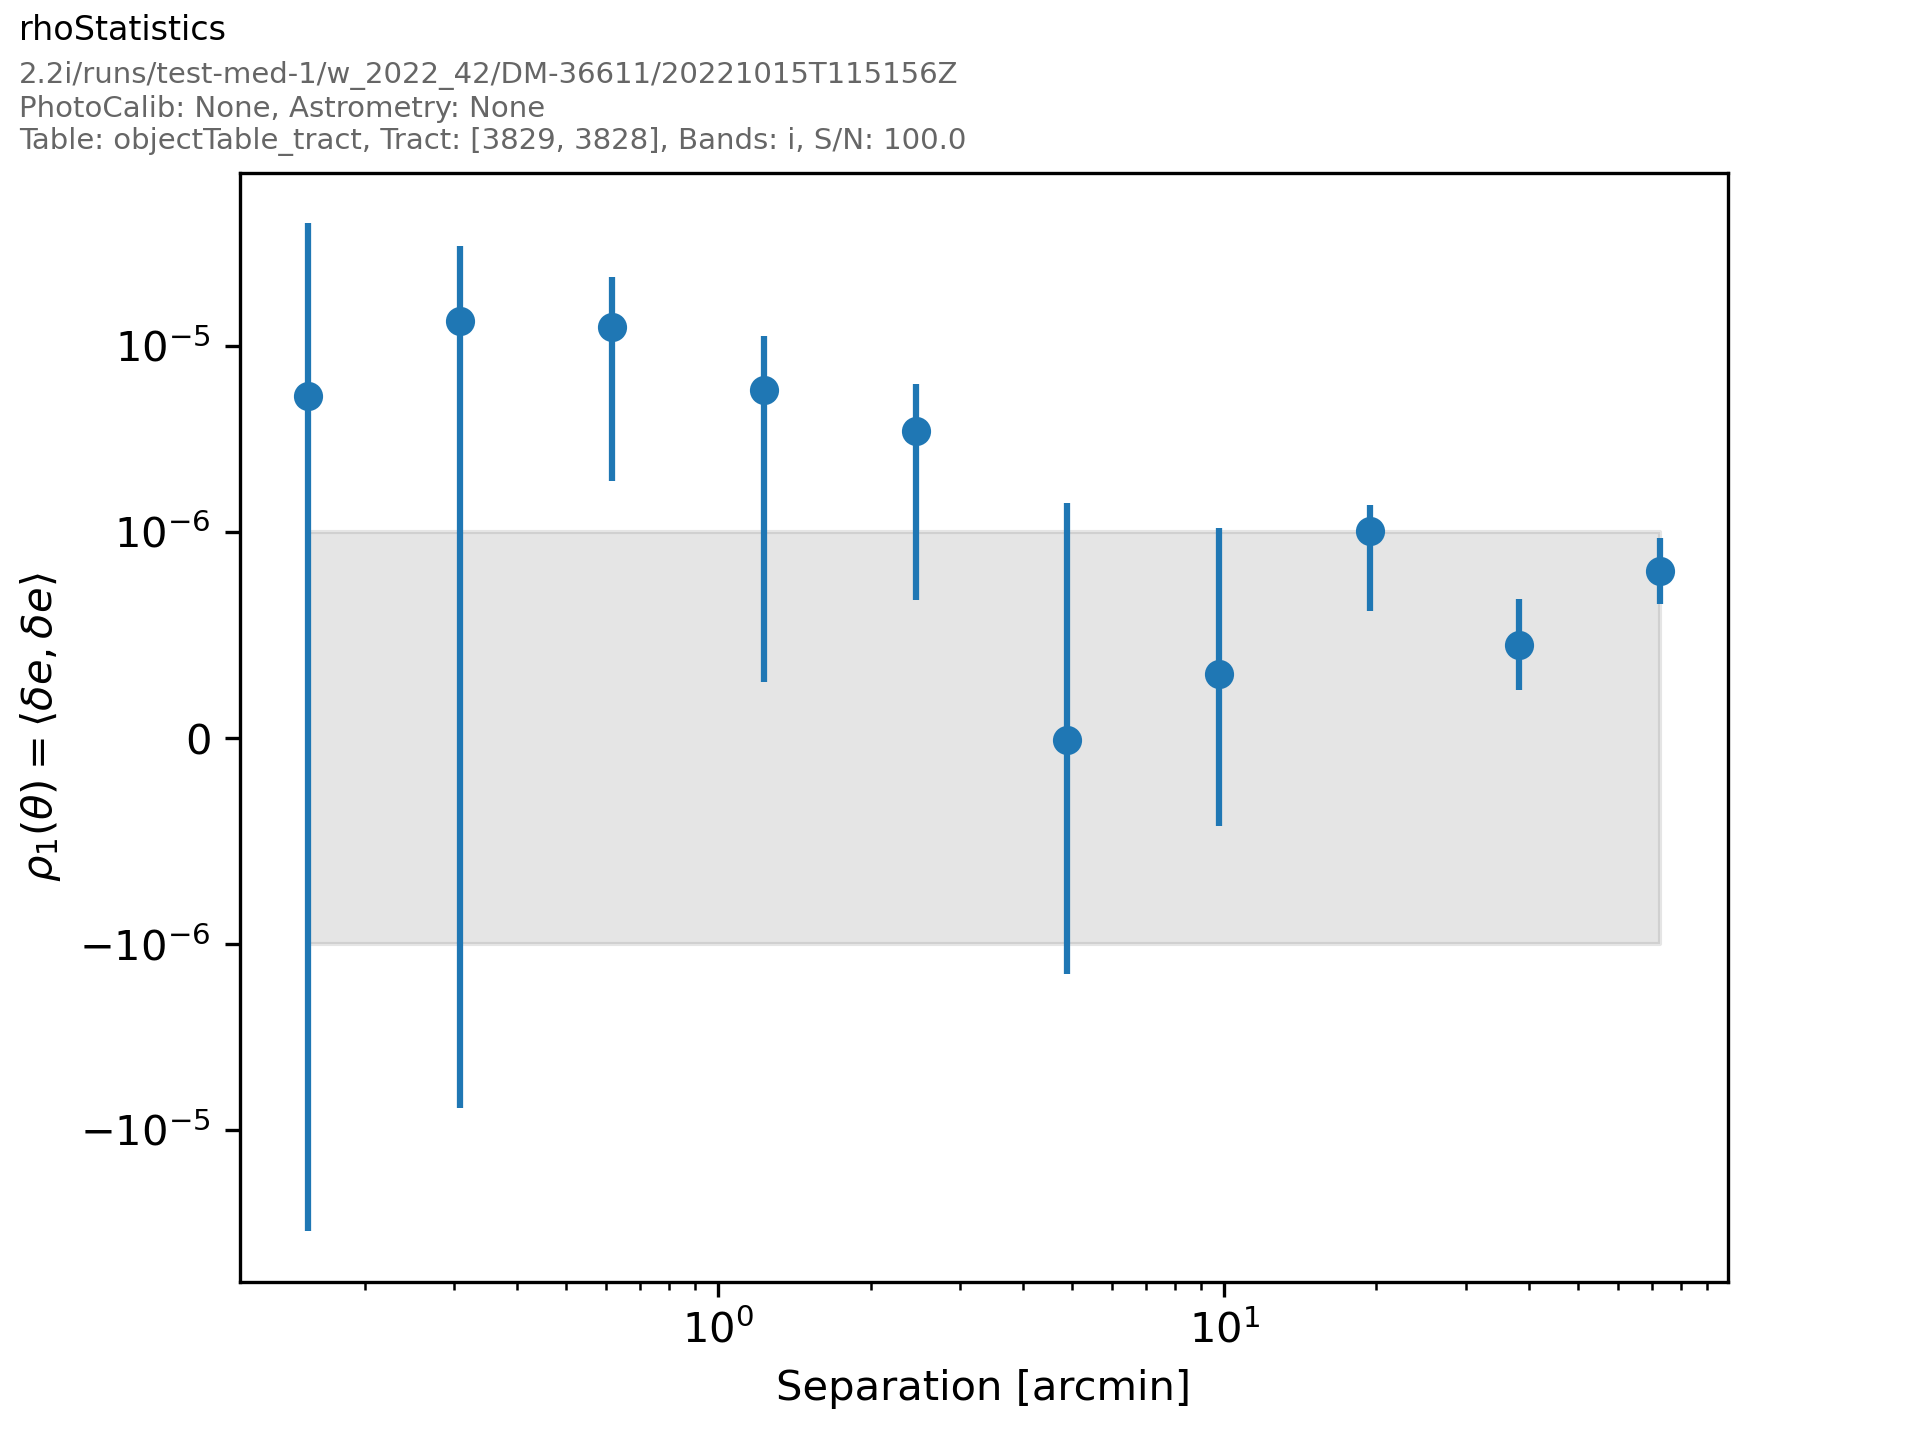
Rho statistics capture the spatial correlation amongst various PSF size and shape residual quantities. For exact definitions, see here.
Attributes Summary
A configurable dict describing the rho statistics to plot.
Methods Summary
__call__(data, **kwargs)Call self as a function.
Return the schema an
AnalysisActionexpects to be present in the arguments supplied to the __call__ method.Returns a list of names that will be used as keys if this action's call method returns a mapping.
makePlot(data[, plotInfo])Make the plot(s).
Subclass hook for computing defaults.
Attributes Documentation
- rhoPlots#
A configurable dict describing the rho statistics to plot. (
ConfigDict, default{})
Methods Documentation
- __call__(data: MutableMapping[str, ndarray[tuple[Any, ...], dtype[_ScalarT]] | Scalar | HealSparseMap | Tensor | Mapping], **kwargs) Mapping[str, Figure]#
Call self as a function.
- getInputSchema() Iterable[tuple[str, type[ndarray[tuple[Any, ...], dtype[_ScalarT]]] | type[Scalar] | type[HealSparseMap] | type[Tensor] | type[Mapping]]]#
Return the schema an
AnalysisActionexpects to be present in the arguments supplied to the __call__ method.Returns#
- result
KeyedDataSchema The schema this action requires to be present when calling this action, keys are unformatted.
- result
- getOutputNames() Iterable[str]#
Returns a list of names that will be used as keys if this action’s call method returns a mapping. Otherwise return an empty Iterable.
Parameters#
- config
lsst.pex.config.Config, optional Configuration of the task. This is only used if the output naming needs to be config-aware.
Returns#
- result
Iterableofstr If a
PlotActionproduces more than one plot, this should be the keys the action will use in the returnedMapping.
- config
- makePlot(data: MutableMapping[str, ndarray[tuple[Any, ...], dtype[_ScalarT]] | Scalar | HealSparseMap | Tensor | Mapping], plotInfo: Mapping[str, str] | None = None, **kwargs: Any) Mapping[str, Figure]#
Make the plot(s).
Parameters#
- data
DataFrame The catalog containing various rho statistics.
- plotInfo
dict, optional - A dictionary of information about the data being plotted with keys:
"run"The output run for the plots (
str)."skymap"The type of skymap used for the data (
str)."filter"The filter used for this data (
str)."tract"The tract that the data comes from (
str).
- **kwargs
Additional keyword arguments to pass to the plot
Returns#
- fig_dict
dict[Figure] The resulting figures. The figure corresponding \(\rho_1(\theta)\) can be accessed with the key
rho1and similarly for the other rho statistics. \(\rho_3'\) is accessed with the keyrho3alt.
Examples#
An example rho statistics plot may be seen below:
For further details on how to generate a plot, please refer to the getting started guide.
- data